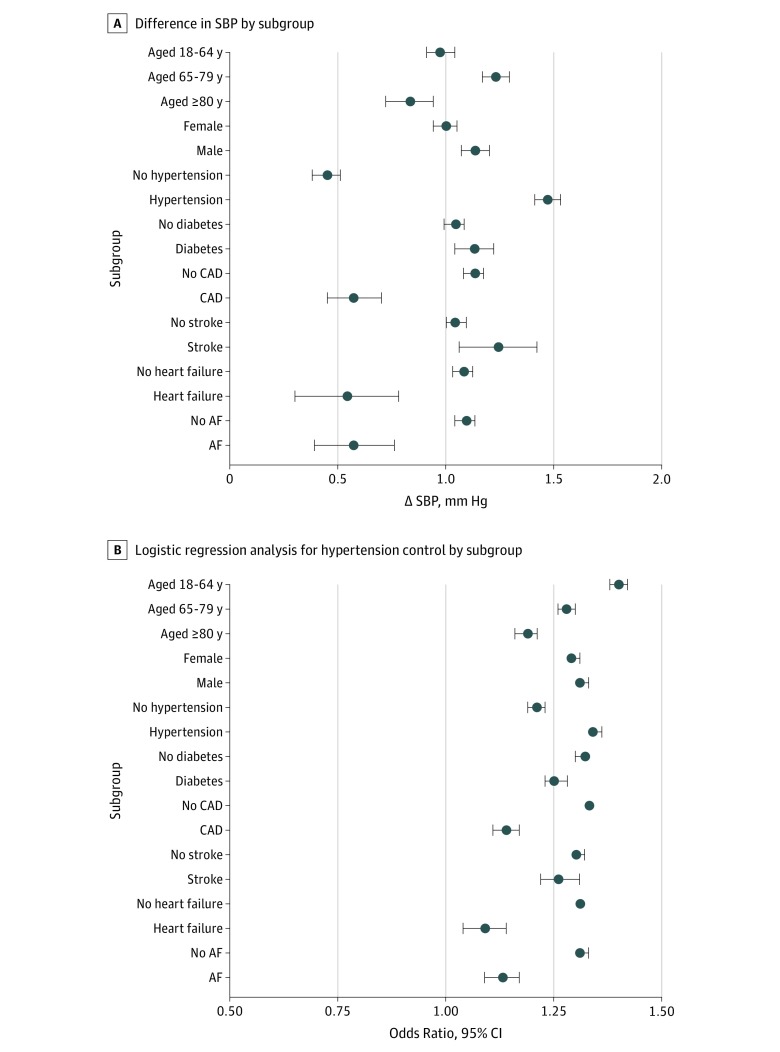
Figure 2. Systolic Blood Pressure (SBP) Difference and Odds Ratio for Hypertension Control by Subgroups.
Analyses for hypertension control included only participants with hypertension diagnosis or systolic blood pressure of 140 mm Hg or higher at the time of inclusion. AF indicates atrial fibrillation; CAD, coronary artery disease.

