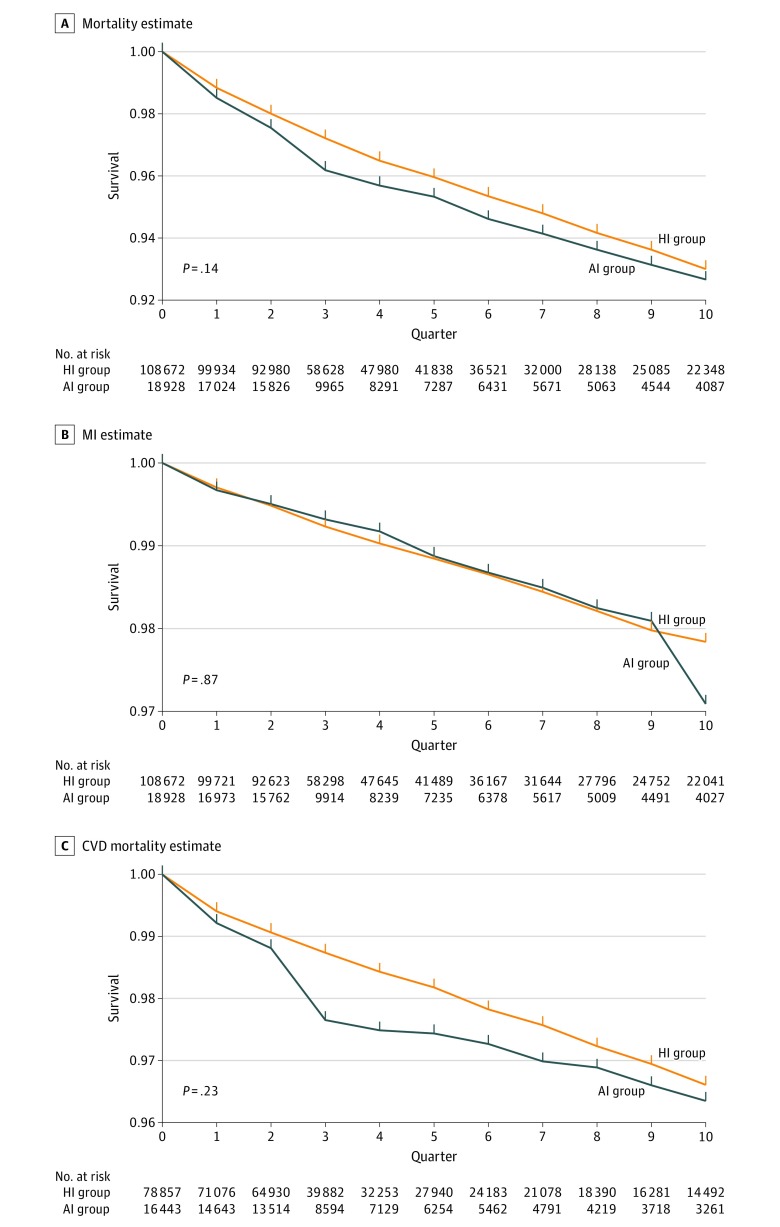
Figure 3. Adjusted Survival Curves for Mortality, Myocardial Infarction (MI), and Mortality Due to Cardiovascular Disease (CVD) Using Inverse Probability Weight Estimation to Fit a Saturated Marginal Structural Model.
Adjusted estimates of the survival curves by insulin therapy regimen are shown for 3 of the 5 outcomes studied. The P value on each plot is the 2-tailed P value of the statistical test that the area between the 2 survival curves is null (ie, the sum of the risk differences at each quarter is equal to 0). AI group indicates patients continuously receiving analogue insulin with or without human insulin; HI group, patients continuously receiving human insulin only.

