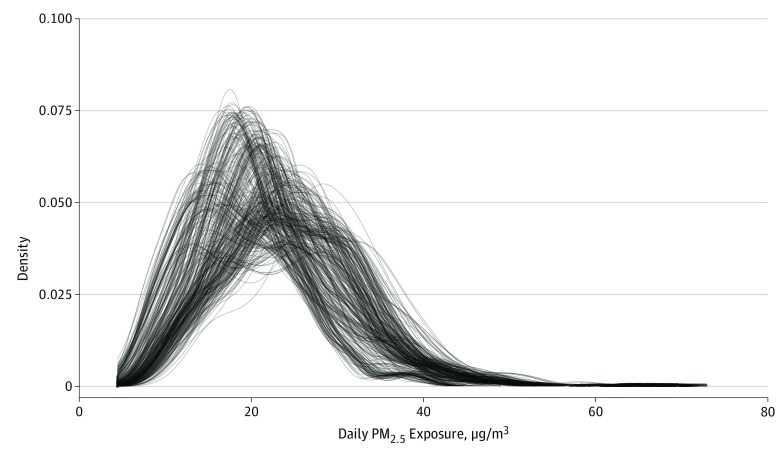
Figure 1. Density Plots of Estimates of Daily Exposure to Particulate Matter With Diameter Less Than 2.5 μm (PM2.5) for All Participants.
Individual daily estimates of prenatal PM2.5 exposure were used for each of the 365 children in the cohort, resulting in 179 144 observations. The mean (SD) PM2.5 exposure was 23.0 μg/m3 (2.7 μg/m3). Each continuous line in the density plot reflects 1 child’s exposures, and the density reflects the frequency of the exposure level for each child. The tails show that all children had very few days of exposure at that high level. Visual inspection of the density plots of each individual’s exposure showed no statistically significant outliers in the mean PM2.5 exposure.

