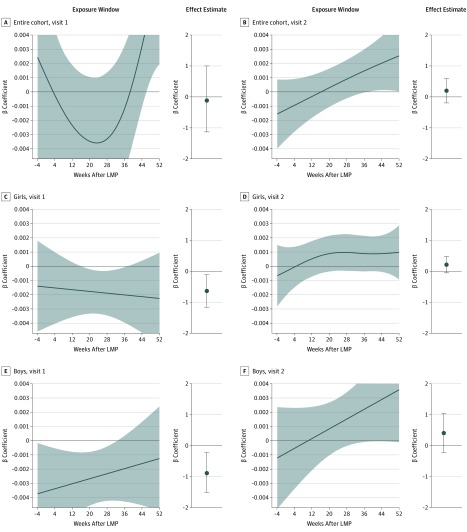
Figure 3. Significant Exposure Windows and Effect Estimates for Exposure to Particulate Matter With Diameter Less Than 2.5 μm (PM2.5) on Hemoglobin A1c (HbA1c) Levels at Visit 1 and Visit 2.
Associations are based on a PM2.5 exposure of 23.0 μg/m3 compared with 12 μg/m3. Shading indicates the 95% CIs. The x-axis of the exposure window plot depicts the week after the last menstrual period (LMP) (0 is LMP), and the y-axis represents the association with HbA1c per day of PM2.5 exposure (percentage per day). The graphs show the point estimate for the association with HbA1c (percentage) per year of exposure to PM2.5. Error bars indicate 95% CIs.

