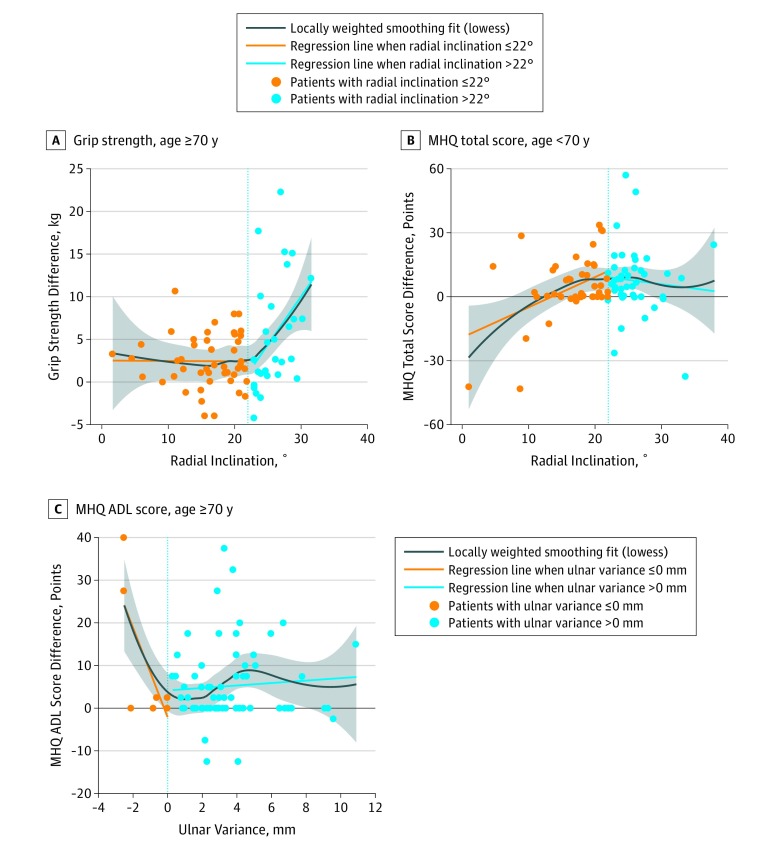
Figure. Multivariable 2-Phase Regression Plots.
The shaded area indicates the 95% CI. Vertical line indicates the normal value for each independent variable (eg, for panel A, the vertical line is at X = 22, which is the accepted normal value for radial inclination). ADL indicates activities of daily living; MHQ, Michigan Hand Outcomes Questionnaire.

