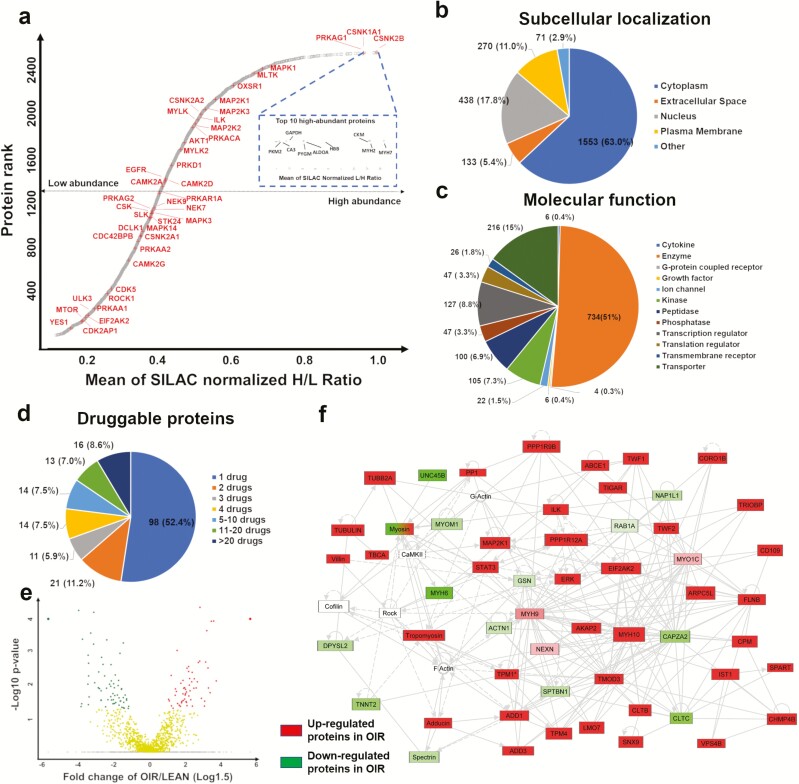
Figure 1.
Proteome profiling of human skeletal muscle a) Dynamic range of protein abundance in skeletal muscle tissue. b) Subcellular localization. c) Molecular function. d) Proteins that are potential targets for FDA approved medications. e) Volcano plots of Log1.5-fold change (cutoff <−1 or >1) and −Log10 P value (cutoff >1.33), where red circles (upper left) represent upregulated proteins in obesity-related insulin resistance (OIR), green circles (upper right) represent downregulated proteins in OIR and yellow circles (center) represent unchanged proteins between Lean and OIR. Note that proteins only identified in OIR are assigned with a cap ratio of a 10-fold change and P = 0.0001 whereas proteins only identified in Lean are assigned with a cap ratio of a 0.1-fold change and P= 0.0001. f) IPA-based networking of significantly changed proteins, green color-coding represents lower abundance and red color-coding represents higher abundance in OIR vs Lean, non–color-coded proteins are not included in the current dataset.

