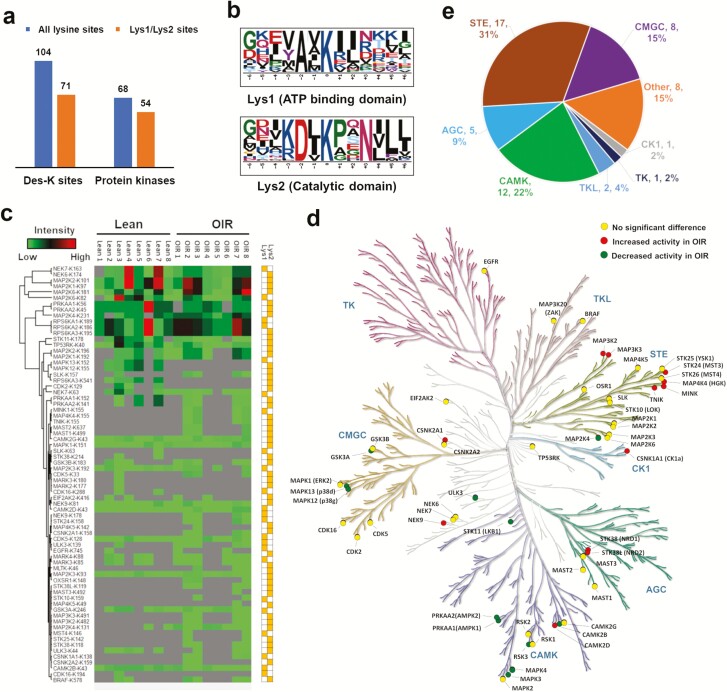
Figure 2.
Active kinome profiling of human skeletal muscle a) Number of specific binding sites and kinases. b) Binding motif analysis of conserved Lys1 and Lys2. c) Hierarchical clustering of 71 identified active kinase sites. d) Color-coded kinome tree according to the differential fold changes of the 54 identified active kinases in Lean and OIR groups, where kinases highlighted in yellow did not show significant change; kinases highlighted in red showed significant increased activity in OIR; kinases highlighted in green showed significant decreased activity. e) Protein kinases classification of the 54 identified active kinases according to the human KinBase (http://kinase.com/human/kinome/).

