
Figure 2.
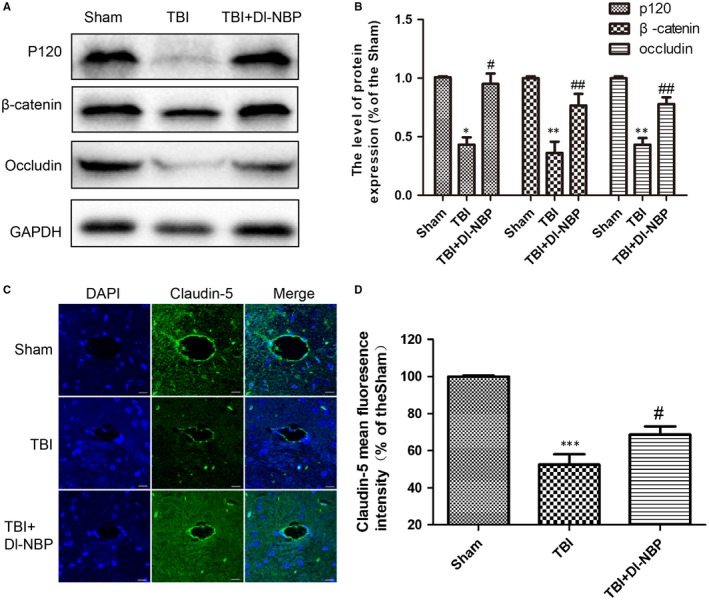
Dl‐NBP prevents BBB disruption by improving the expressions of junction proteins at 3 d post‐TBI. A, Representative Western blot analyses of P120‐catenin, β‐catenin and occludin in the cerebral cortex. B, Quantification of the Western blot data for the junction proteins. C, Representative fluorescence images of claudin‐5(green) and DAPI stained nuclei(blue). Scale bar = 100 μm. D, Quantification of fluorescence intensity from (C). Data represent the mean value ± SEM, n = 6. **P < .01 and ***P < .001 vs the sham group; #P < .05 and ##P < .01 vs the TBI group