
Figure 3.
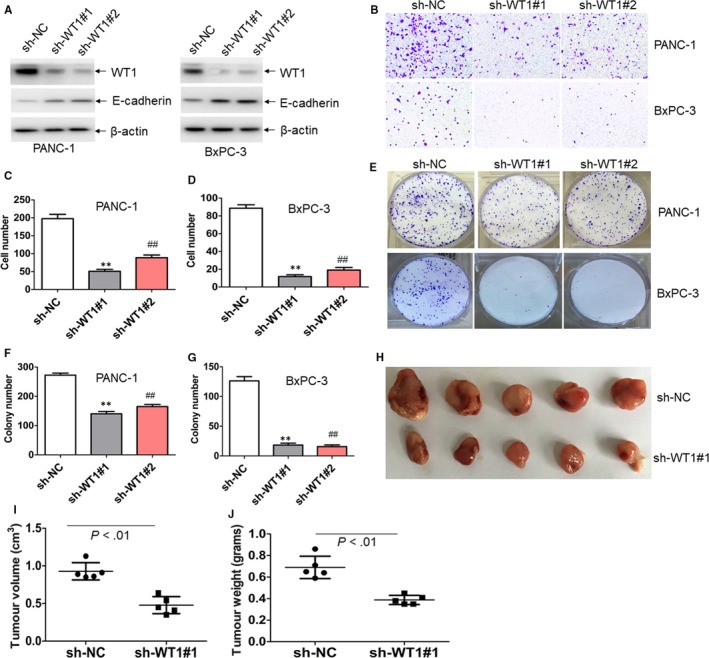
Knockdown of WT1 resembles the anti‐cancer activity of degrasyn. (A) The protein expressions of WT1 and E‐cadherin were detected in PANC‐1 and BxPC‐3 cells, which were transduced with two specific shRNAs for WT1 (sh‐WT1#1 and sh‐WT1#2) or non‐specific shRNA (sh‐NC) followed by puromycin selection for seven days. (B–D) Transwell migration assays were performed in PANC‐1 and BxPC‐3 cells transduced with sh‐WT1#1, sh‐WT1#2 or sh‐NC. ** and ## P < .01. Shown is the representative plot (B) and summary of cell number (C and D). (E–G) Colony formation was performed in PANC‐1 and BxPC‐3 cells transduced with sh‐WT1#1, sh‐WT1#2 or sh‐NC. ** and ## P < .01. Shown is the representative plot (E) and summary of colony number (F and G). (H–J) PANC‐1 cells with sh‐NC or sh‐WT#1 were injected subcutaneously into right flank of mice to construct xenograft mouse model. (H) A photograph of tumours in mice transplanted with PANC‐1 cells, which were transduced with sh‐NC (N = 5) or sh‐WT1#1 (N = 5). (I) Volumes of all tumours were measured when the experiment was terminated. (J) Net weights of all tumours were measured at the termination of the experiment