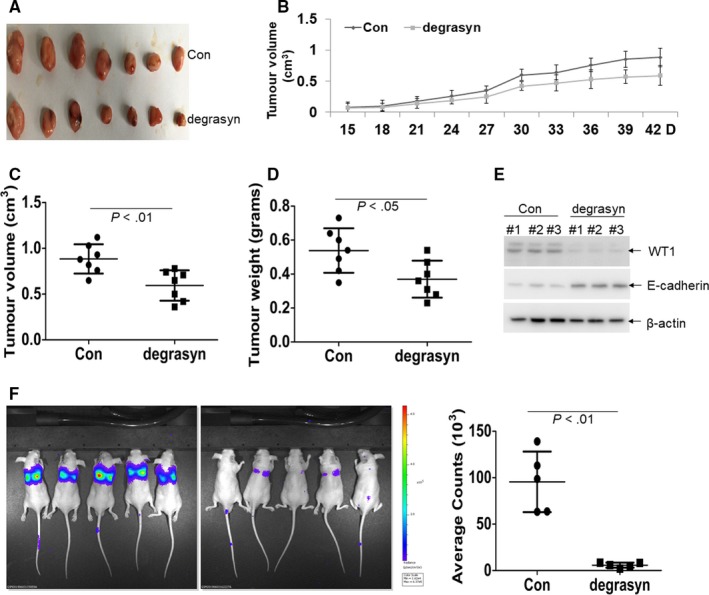
Figure 7.

The anti‐cancer effects of degrasyn in PANC‐1‐xenografted mice model. (A) A photograph of tumours in degrasyn‐treated mice (N = 7) and control mice (N = 7). (B) Volumes of all tumours were detected every three days two weeks after tumour inoculation. (C) Volumes of all tumours were measured when the experiment was terminated at 42 days after tumour cell inoculation. (D) Net weights of all tumours were measured at the termination of the experiment. (E) The protein levels of WT1 and E‐cadherin were detected in three tumour lysates from degrasyn‐treated mice or control mice. (F) Luciferase intensity was performed in PANC‐1‐Luc‐transplanted mice, which were treated with or without degrasyn. Shown is the picture of the luciferase intensity (Left) and the summary of luciferase intensity (Right). N = 5 for each group
