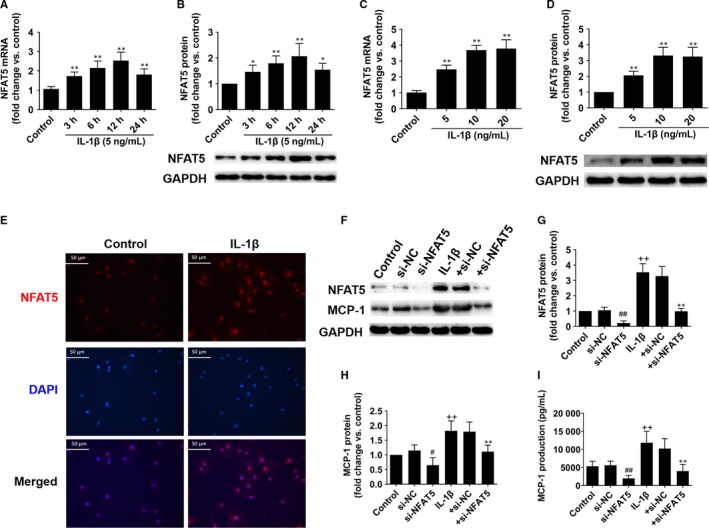
Figure 3.

NFAT5 regulates MCP‐1 expression in HUVECs. A and B, NFAT5 mRNA and protein expressions in HUVECs treated with IL‐1β (5 ng/mL) at different time points. C and D, NFAT5 mRNA and protein expressions in HUVECs treated with different concentrations of IL‐1β for 12 h. E, Representative immunofluorescence staining of NFAT5 (red) and DAPI (blue) in HUVECs treated with IL‐1β (10 ng/mL) for 12 h. F‐H, Representative of Western blot images and quantification of NFAT5 and MCP‐1 protein expressions in HUVECs treated with si‐NFAT5 (20 nmol/L) or si‐NC (20 nmol/L) under basal or IL‐1β (10 ng/mL) stimulation for 12 h. I, The MCP‐1 concentration in culture supernatant of HUVECs treated with si‐NFAT5 (20 nmol/L) or si‐NC (20 nmol/L) under basal or IL‐1β (10 ng/mL) stimulation for 12 h. *P < .05, **P < .01, for IL‐1β vs control (A‐D), +si‐NC vs + si‐NFAT5 (G‐I); # P < .05, ## P < .01 vs si‐NC (G‐I); ++ P < .01 vs control (G‐I). Each experiment was repeated three times. NC, negative control
