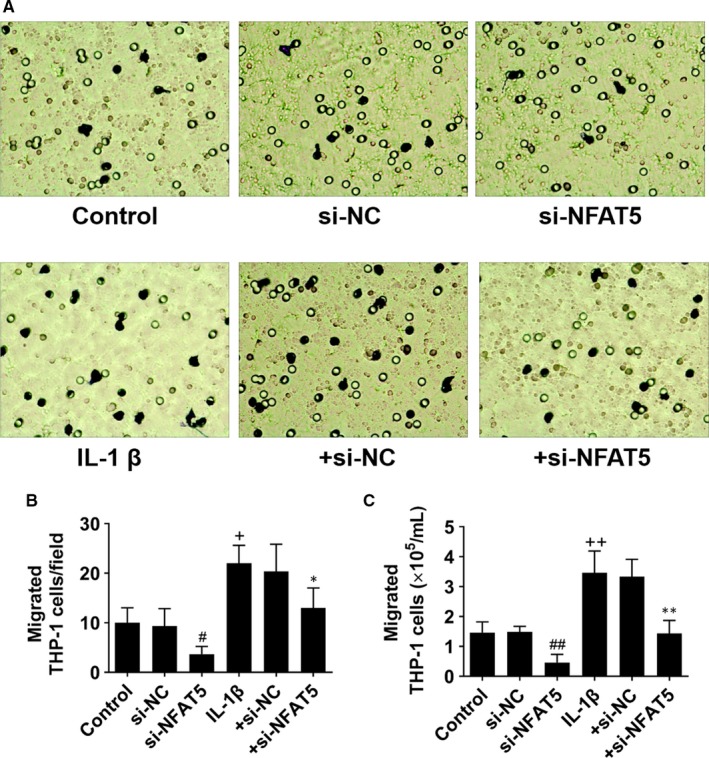
Figure 4.

NFAT5 knockdown inhibits chemotaxis of THP‐1 cells. A, Representative images of migrated THP‐1 cells supplemented with the culture supernatant of HUVECs which had been incubated in si‐NFAT5 (20 nmol/L) or si‐NC (20 nmol/L) under basal or IL‐1β (10 ng/mL) stimulation for 12 h. B, The number of migrated THP‐1 cells on the reverse surface of the membrane. C, The number of migrated THP‐1 cells in the lower medium. *P < .05, **P < .01 vs + si‐NC; + P < .05, ++ P < .01 vs control; # P < .05, ## P < .01 vs si‐NC. Each experiment was repeated three times. NC, negative control
