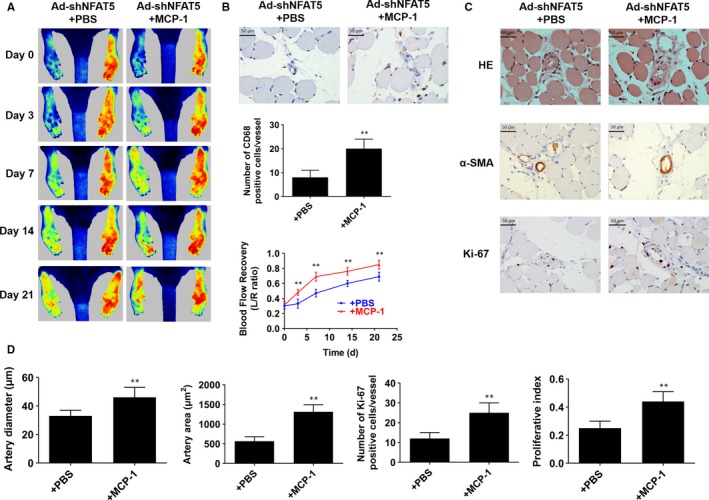
Figure 6.

MCP‐1 delivery recovery arteriogenesis which is inhibited by NFAT5 knockdown. A, Representative images of laser speckle perfusion images and statistical analysis of the ratios of left to right (L/R) hindlimb blood perfusion in NFAT5 knockdown rats treated with MCP‐1 delivery at various time points after FAL. B, Representative of immunohistochemistry staining and quantification of CD68 in adductor muscles selected from NFAT5 knockdown rats treated with MCP‐1 delivery 3 d after FAL. C, HE staining, immunohistochemistry of α‐SMA and Ki‐67 in cross‐sections of the adductor muscles collected from NFAT5 knockdown rats treated with MCP‐1 delivery 21 d after FAL. D, Quantification of images from (C), collateral artery diameter and lumen areas were assayed by α‐SMA staining, and proliferating cells were measured by Ki‐67 staining. Scale bar = 50 μm. **P < .01 vs + PBS; N = 6 rats in each group
