Figure 3.

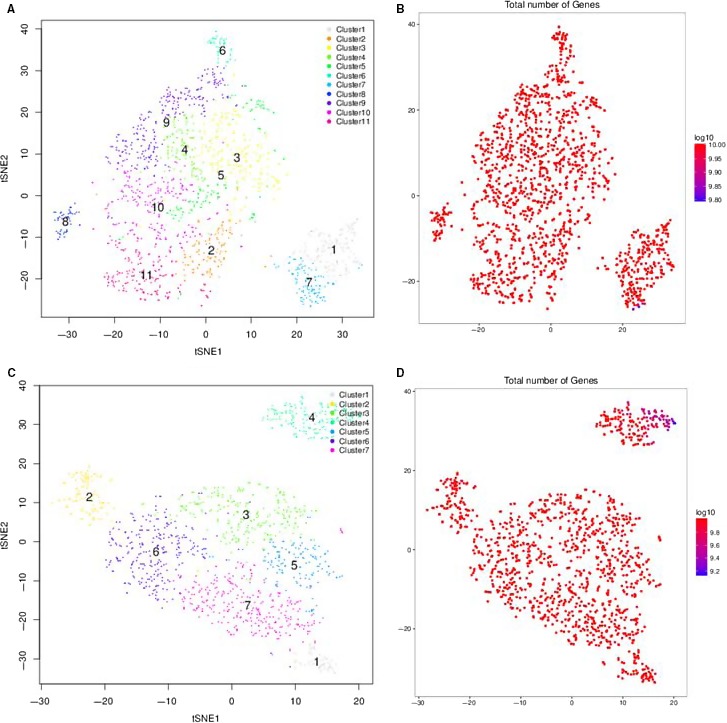
Subpopulation discovery in hUC‐MSCs (A‐B) and hSF‐MSCs (C‐D) by t‐SNE analysis. Based on our PCA and t‐SNE results, there were 11 clusters present in hUC‐MSCs and 7 in hSF‐MSCs

Subpopulation discovery in hUC‐MSCs (A‐B) and hSF‐MSCs (C‐D) by t‐SNE analysis. Based on our PCA and t‐SNE results, there were 11 clusters present in hUC‐MSCs and 7 in hSF‐MSCs