
Figure 7.
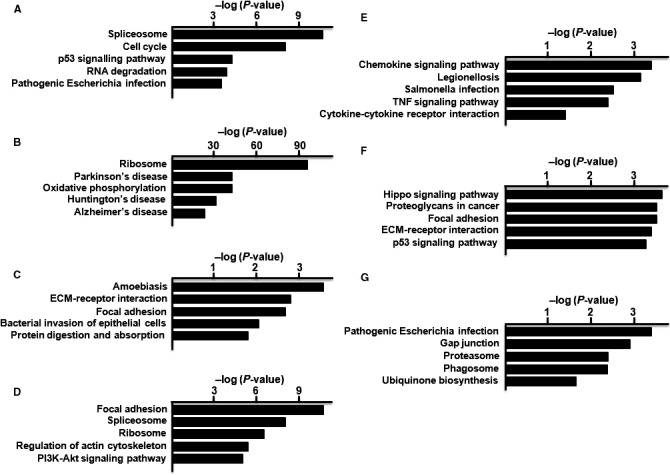
KEGG analysis of the DEGs of hSF‐MSCs. KEGG classification of differentially regulated genes in cluster 1 (A), cluster 2 (B), cluster 3 (C), cluster 4 (D), cluster 5 (E), cluster 6 (F) and cluster 7 (G)
Official websites use .gov
A
.gov website belongs to an official
government organization in the United States.
Secure .gov websites use HTTPS
A lock (
) or https:// means you've safely
connected to the .gov website. Share sensitive
information only on official, secure websites.
KEGG analysis of the DEGs of hSF‐MSCs. KEGG classification of differentially regulated genes in cluster 1 (A), cluster 2 (B), cluster 3 (C), cluster 4 (D), cluster 5 (E), cluster 6 (F) and cluster 7 (G)