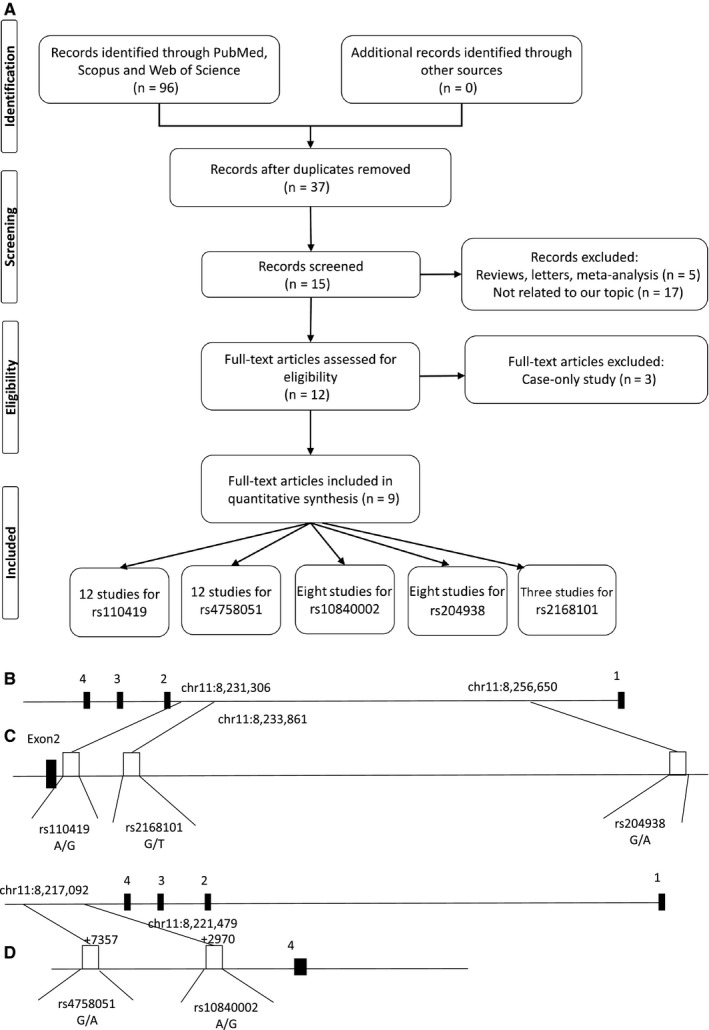
Figure 1.

Basic information about the presented study. (A) Flow chart of the study selection procedure, (B) map of the human LMO1 gene (USCS genome browser: chr11:8,224,449‐8,263,388). Exons 1‐4 are numbered and represented by black boxes. C) Positions of the single‐nucleotid variations within the first intron of the LMO1 gene (D) positions of the single‐nucleotid variations within the 3′ UTR region of the LMO1 gene (not up to scale)
