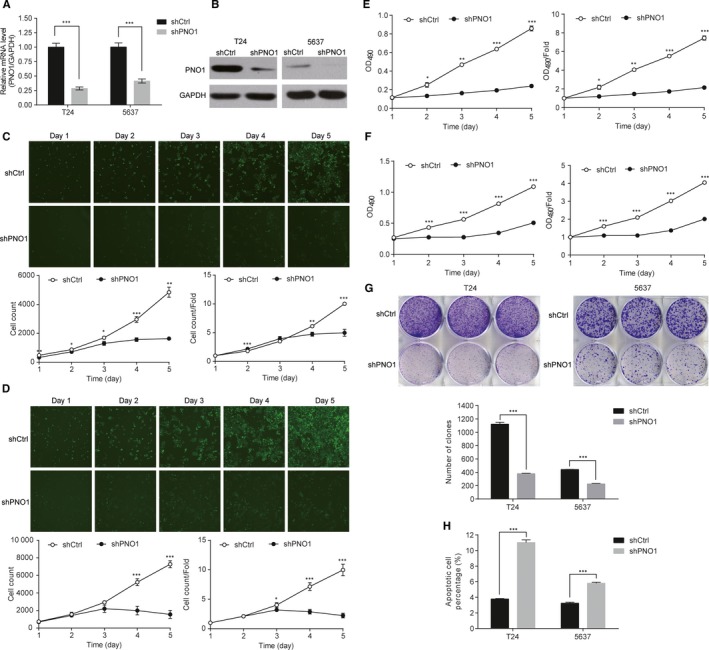
Figure 2.

PNO1 knockdown affected the proliferation and survival of T24 and 5637 bladder cells. (A) qRT‐PCR showing significantly reduced mRNA expression level of PNO1 against GAPDH in PNO1 knockdown cells. (B) Western blot showing reduced PNO1 protein expression in PNO1 knockdown cells. (C) Growth curves of T24 cells and (D) 5637 cells measured by automated cell counting. (E) Growth curves of T24 cells and (F) 5637 cells measured by MTT assay. (G) Comparison of colony forming ability between control and PNO1 knockdown cells. (H) Comparison of the percentage of apoptotic cells between control and PNO1 knockdown cells. *P < .05; **P < .01; ***P < .001
