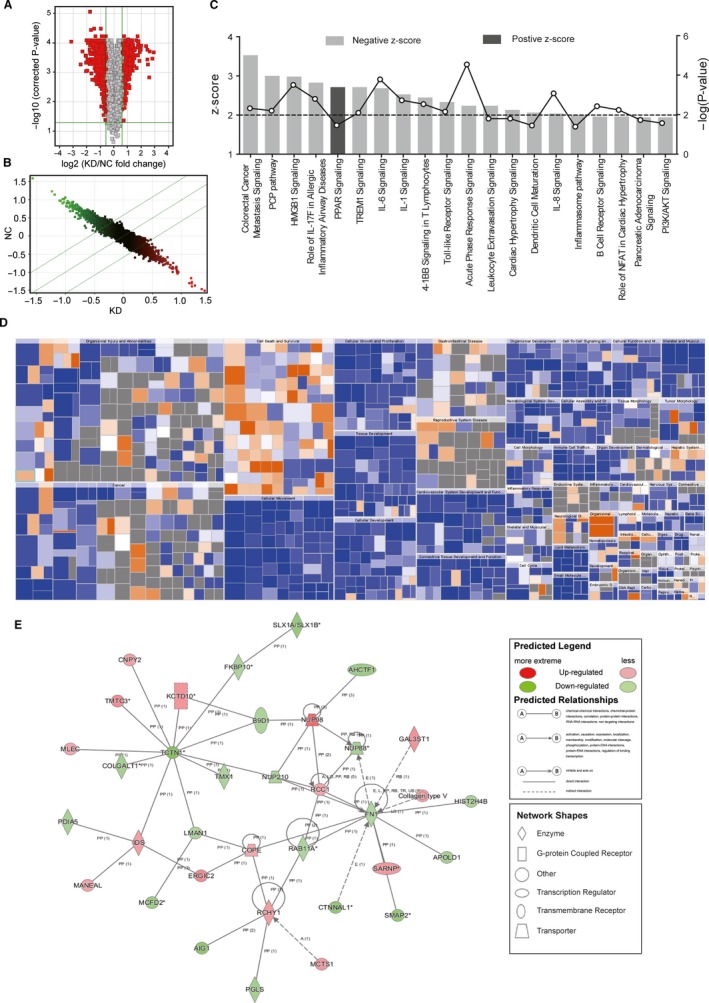
Figure 4.

Ingenuity pathway analysis of DNA microarray data of NC and PNO1 KD T24 cells. (A) Volcano diagram demonstrating the distribution of DEGs between NC and KD group. Red dots represented probes with |FC| > 1.5 and P < .05. (B) Scatter diagram showing the distribution of signals in the Cartesian coordinate system. Dots above the top green line were down‐regulated probes in KD group comparing to NC. Dots below the bottom green line were up‐regulated probes in KD group comparing to NC. (C) Signal pathway histogram showing the enrichment of DEGs in canonical signalling pathways. Z‐score (bars) reflected the extent to which the pathway was suppressed (Z‐score < 0) or activated (Z‐score > 0). |Z‐score| > 2 was the threshold of significance. −log(P‐value; dots and lines) reflected the likelihood of the involvement of this pathway. (D) Heat map showing the participation of DEGs in diseases and physiological functions. Orange, Z‐score > 0; blue, Z‐score < 0; and grey, no Z‐score. (E) Interaction network diagram of molecules within the top‐scored network
