Figure 5.

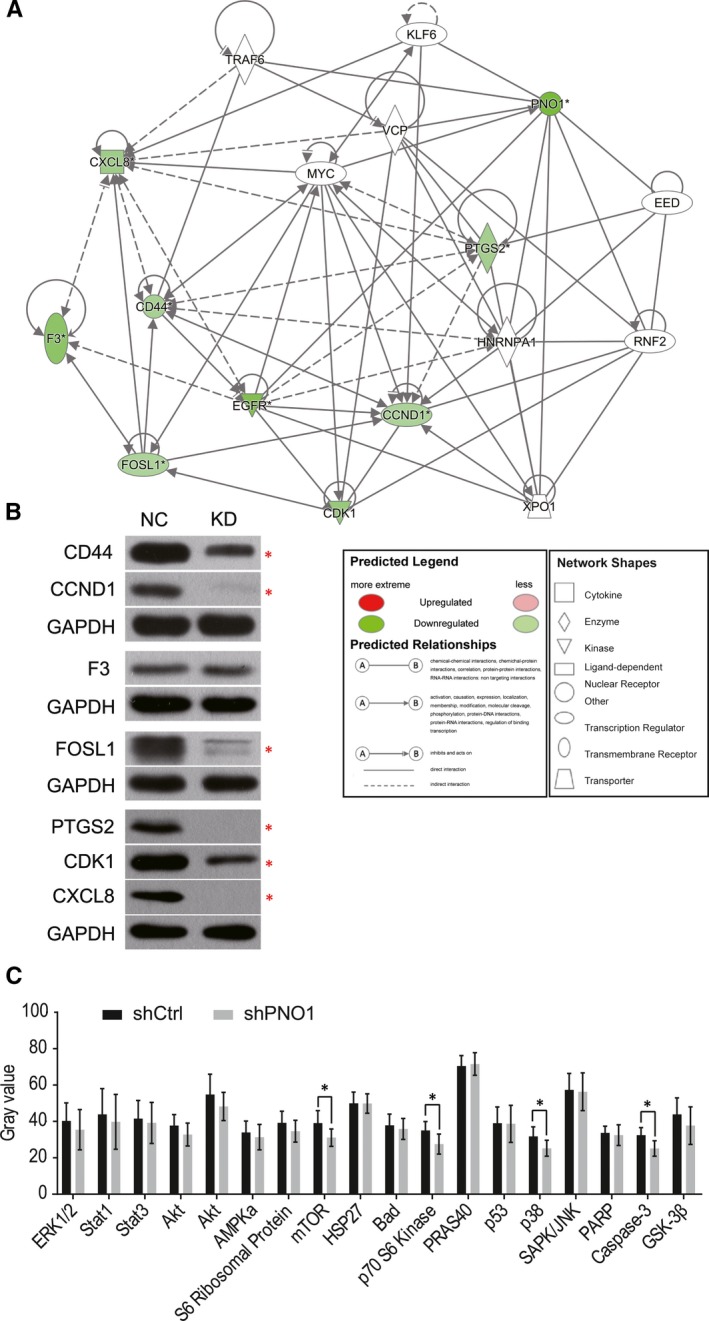
PNO1 downstream gene expression. (A) Interaction network diagram of PNO1 with selected downstream genes. (B) Western blot of PNO1 downstream genes in T24NC and T24KD cells. (C) Comparison of the expression of 18 key node proteins of intracellular signalling pathways that are closely associated with diseases in T24NC and T24KD cells. *P < .05
