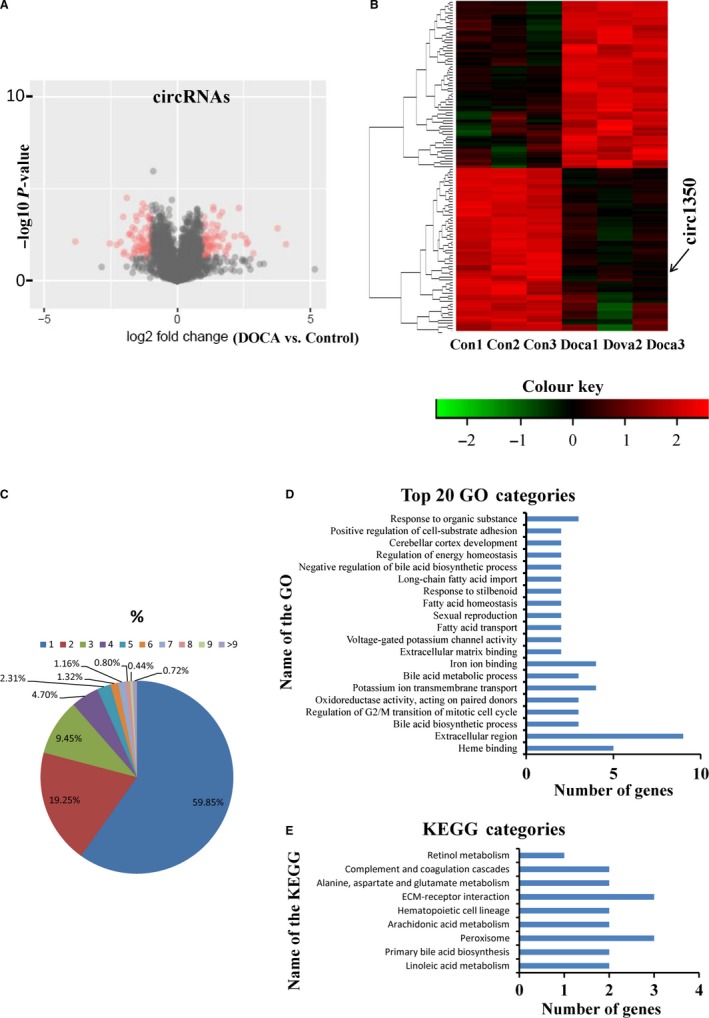
Figure 3.

Differential expression of circRNAs and its correlation and regulation with their parental linear transcripts in the kidneys of the control and DOCA‐salt‐induced hypertensive mice. (A) Volcano plots showing the significant up‐regulated and down‐regulated circRNAs, (B) A cluster analysis heat map showing 124 differentially expressed circRNAs in the kidneys of the control mice and the mice treated with DOCA‐salt for 14 d. n = 3 mice/group. (C) The numbers of circRNAs produced by the same gene. Gene ontology (D) and Kyoto Encyclopaedia of Genes (KEGG) terms (E) of host genes from which differentially expressed circRNAs were identified
