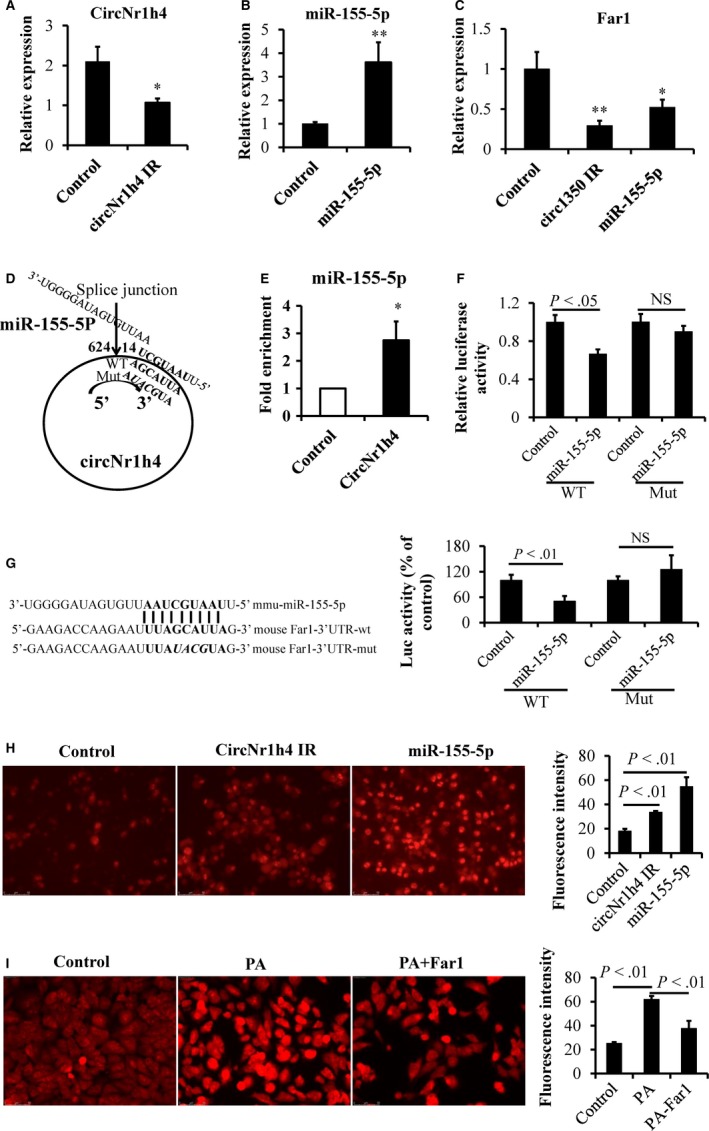
Figure 7.

circNr1h4 regulates Far1 by sponging miR‐155‐5p. (A) The circNr1h4 inhibitor (IR) significantly decreased the expression level of circNr1h4, and (B) the miR‐155‐5p mimic significantly increased the expression level of miR‐155‐5p in mouse kidney collecting duct cells (M1). (C) The circNr1h4 IR or miR‐155‐5p mimic significantly decreased Far1 expression levels in M1 cells. (D) CircNr1h4 contains one site that is complementary to miR‐155‐5p, as predicted by TargetScan. (E) miR‐155‐5p was pulled down by the circNr1h4 probe, and miR‐155‐5p was analysed by qPCR. (F) miR‐155‐5p inhibits luciferase activities from the wild‐type pmirGLO‐circNr1h4 vector. (G) The miR‐155‐5p binding site in the Far1 3′UTR is shown; miR‐155‐5p inhibits luciferase activities from the wild‐type pmirGLO‐Far1 vector. (H) Representative images of M1 cells were stained with dihydroethidium (DHE) after the circNr1h4 inhibitor or miR‐155‐5p mimic treatment for 24 h, Fluorescence intensity of 50 cells from each sample was measured. (I) Representative images of M1 cells were stained with DHE after palmitate (PA) treatment for 18 h or/and Far1 overexpression treatment for 48 h. Fluorescence intensity of 50 cells from each sample was measured. Scale bar: 50 μm; n = 3 replicates/group; *P < .05 and **P < .01 vs the control group; NS indicates no significant difference
