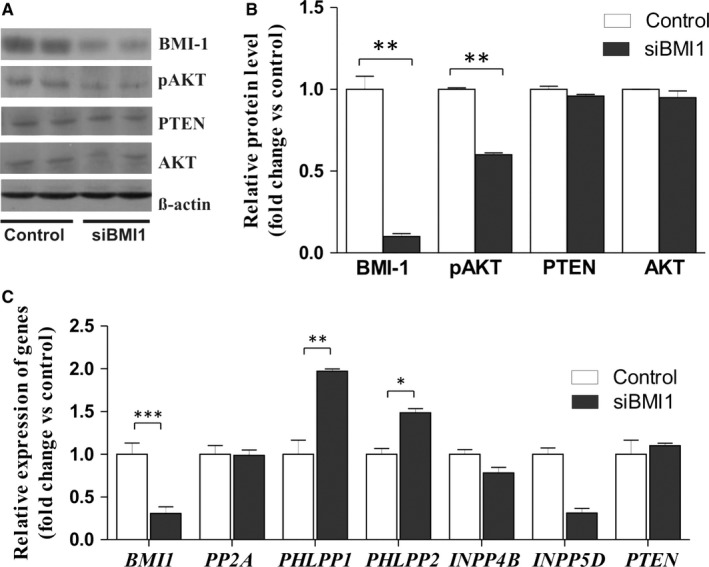
Figure 1.

Effect of BMI‐1 down‐regulation on AKT phosphorylation level and expression of phosphatases in HEC1A cells. A, Representative immunoblots showing BMI‐1, PTEN, AKT proteins and phosphorylated AKT in HEC1A cells treated for 48 h with 30 nmol/L BMI‐1 siRNA or scrambled siRNA (control). B, Bar graph shows the densitometric analysis of BMI‐1, PTEN, AKT and phosphorylated AKT (pAKT) levels in cells treated with BMI‐1 siRNA and scrambled siRNA and represents the mean ± SD of three independent experiments. C, Relative changes in BMI1, PP2A, PHLPP1, PHLPP2, INPP4B, INPP5D and PTEN mRNAs expression levels in siRNA treated cells compared to untreated cells; bar graph represents the mean ± SD. * P < .05, ** P < .01
