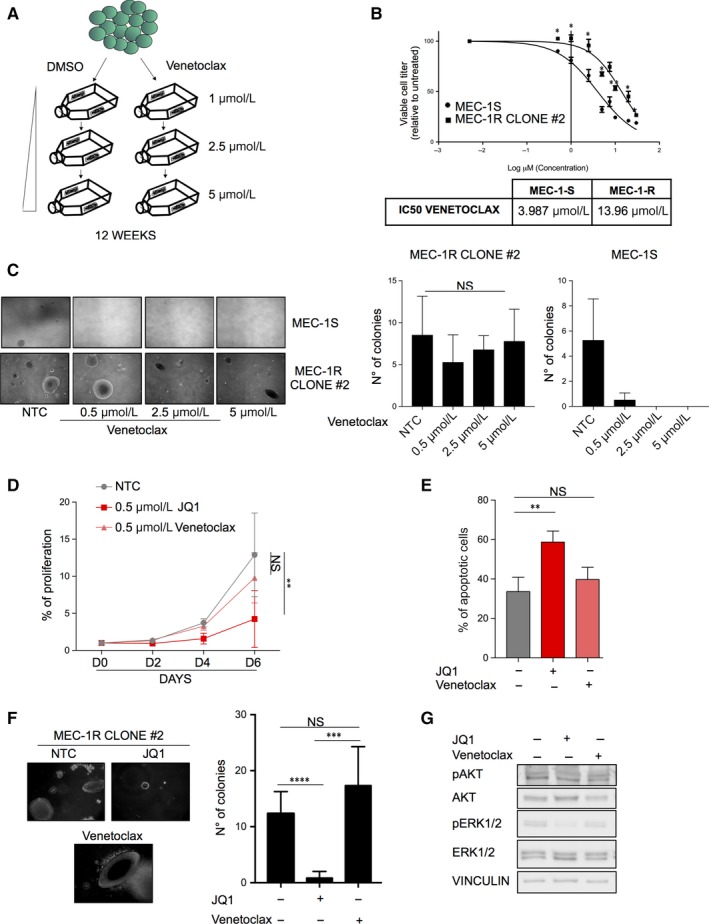
Figure 4.

JQ1 treatment is effective against venetoclax‐resistant CLL cells. A, Schematic representation of venetoclax‐resistant MEC‐1 clones generation. B, Dose‐response curves of MEC‐1 cells lines treated for 48 h with JQ1 and analysed by CTG assay; IC‐50 values of venetoclax in MEC‐1 sensitive and resistant cells. C, Left panel: representative images of soft‐agar growth assay in MEC‐1 cells treated with different venetoclax concentrations (0.005‐0.5‐2.5‐5 µmol/L) for 11 d and quantification of soft agar colony formation; right panel: quantification of soft agar colony formation in MEC‐1 cells treated as previously described. D, Cells were cultured in the presence or absence of JQ1 and cell counts were measured every 48 h for 144 h by CTG assay. E, venetoclax resistant cells were treated with JQ1 72 h. The percent of apoptotic cells was determined by Annexin V staining and flow cytometry. F, Representative images and quantification of soft agar colony formation of venetoclax‐resistant cells after 15 d of treatment with 0.5 µmol/L venetoclax and 0.5 µmol/L JQ1. G, Representative immunoblots of MEC‐1 and EHEB cells treated with the JQ1 for 48 h. Immunoblot analyses were conducted for the expression levels of p‐ERK1/2, ERK1/2, p‐AKT, AKT and vinculin in the cell lysates
