
Figure 2.
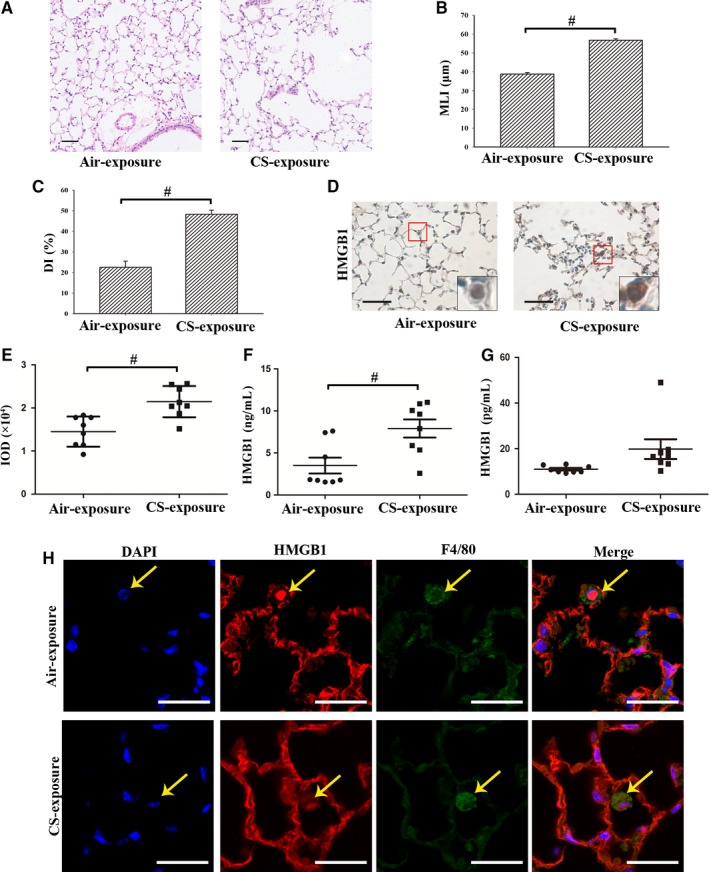
HMGB1 was highly expressed and underwent nucleocytoplasmic translocation in lung macrophages from the CS‐induced mouse model. A, Representative H&E‐stained lung sections showed lung destruction with enlargement of airway spaces. Bar: 50 μm. (B‐C) Quantification of emphysema by mean linear intercept (MLI) and destructive index (DI). D, Representative immunohistochemistry of HMGB1 in lung tissues of CS‐exposed and air‐exposed mice. Bar: 50 μm. E, The integrated optical density (IOD) in immunohistochemistry of HMGB1. F, Level of HMGB1 was measured in serum. G, Level of HMGB1 was measured in bronchoalveolar lavage fluid (BALF). H, Representative immunofluorescence of co‐localization of HMGB1 and F4/80 in lung tissue of CS‐exposed and air‐exposed mice. Bar: 25 μm. # P < .05. N = 8 in each group. Values are mean ± SEM