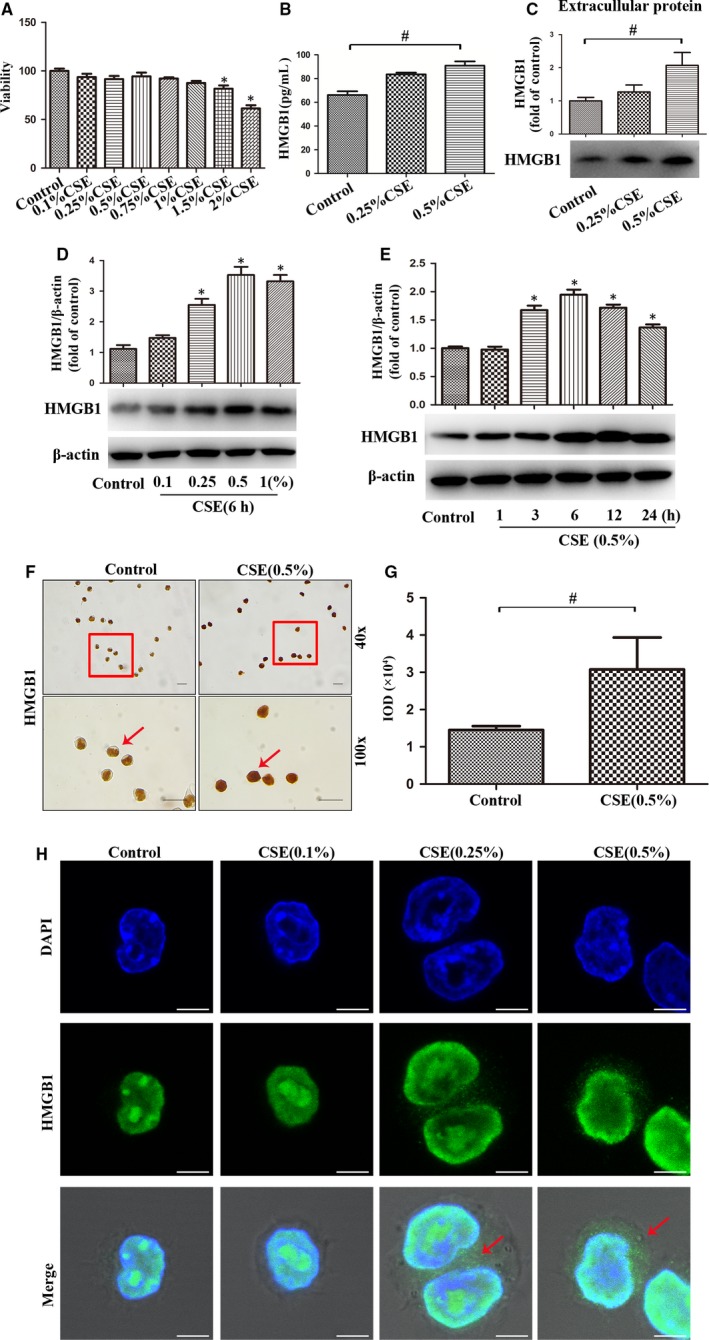
Figure 3.

CSE promoted the expression, nucleocytoplasmic translocation and release of HMGB1 in lung macrophages. A, MH‐S cells were treated with CSE for 24 h, and cellular viability was assessed by MTT. (B‐C) After MH‐S cells were treated with CSE (0.25% or 0.5%) for 24 h, level of HMGB1 in cultured supernatants was measured by ELISA and Western blot. D, Expression of HMGB1 was quantified in MH‐S cells after incubation with different concentrations of CSE for 6 h. E, Expressions of HMGB1 was quantified in MH‐S cells after incubation with 0.5% CSE at the indicated time points. F, Expression and localization of HMGB1 in MH‐S cells after CSE incubation for 6 h by immunocytochemistry. Bar: 20 μm. G, The integrated optical density (IOD) in immunocytochemistry of HMGB1. H, Localization of HMGB1 in MH‐S cells after CSE (0.1%, 0.25% or 0.5%) incubation for 6 h was assessed by immunofluorescence. Bar: 5 μm. *P < .05 vs Control group. # P < .05. Values are mean ± SEM of three independent experiments
