
Figure 2.
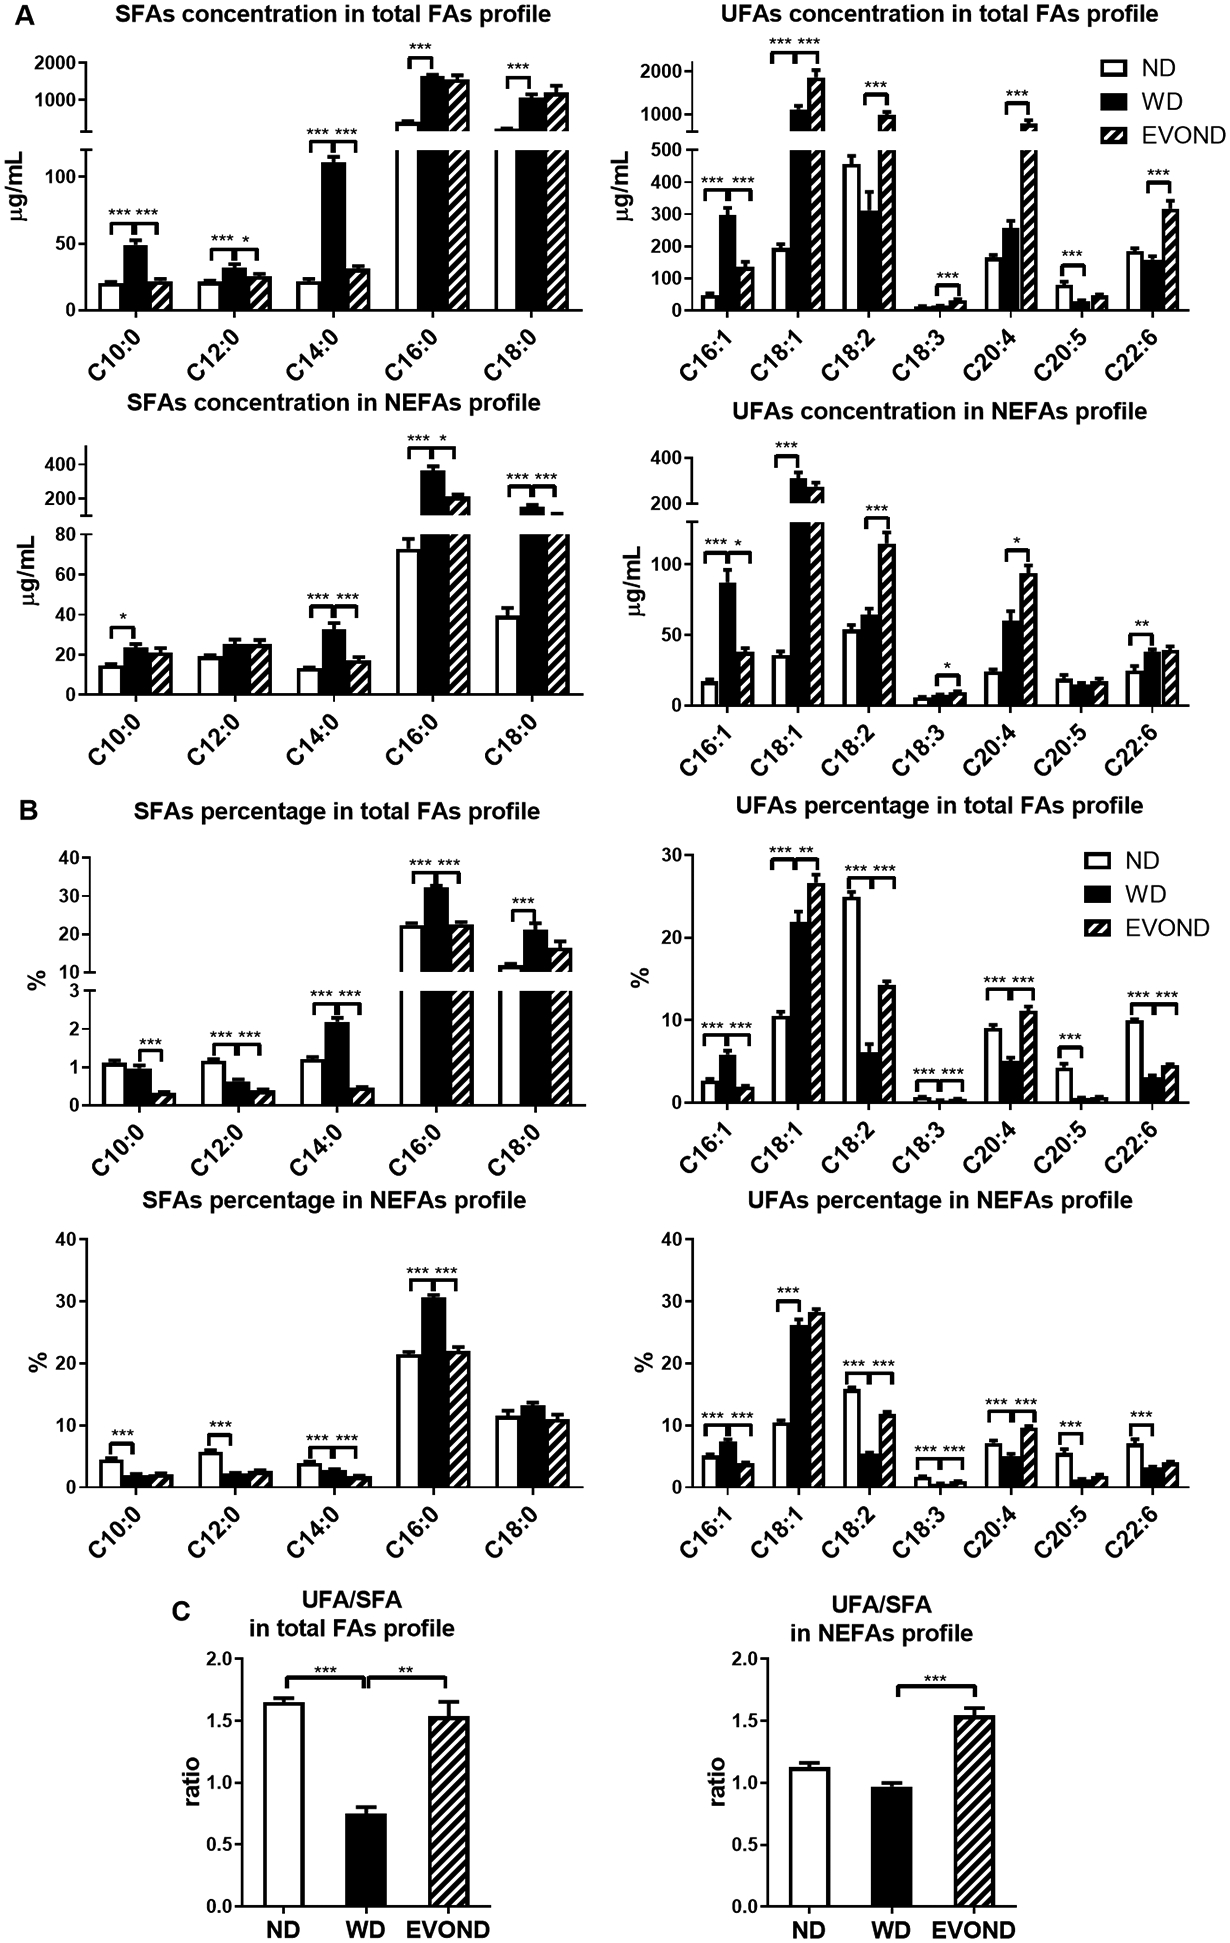
Plasma fatty acid (FA) profiles showed higher unsaturated fatty acid (UFA) and lower saturated fatty acid (SFA) concentrations in mice on EVOND than on WD. A, Concentrations of each SFA and UFA in total hydrolyzed FA profiles or nonesterified fatty acid (NEFA) profiles. B, Percentages of each SFA and UFA in total hydrolyzed FA profiles or NEFA profiles. C, UFA/SFA ratio in total hydrolyzed FA profiles or NEFA profiles. Data are shown as mean±SEM (n=9–12/group); *p<0.05, **p<0.01, ***p<0.001.