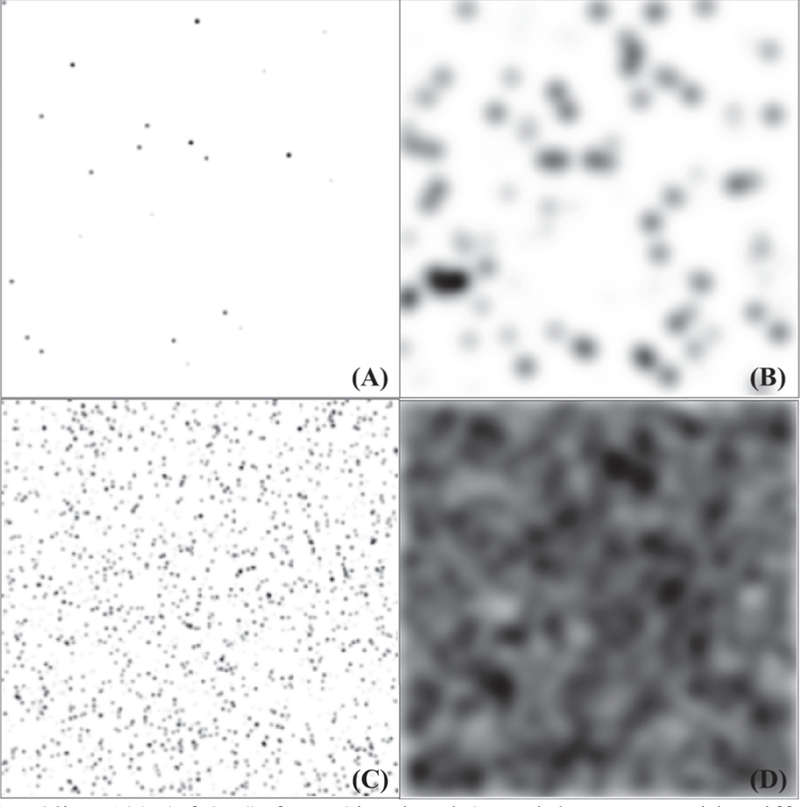
Fig. 1.

Slice 100 (of 256) from Simulated 3D Blob Images with Different Parameter Settings ranging from least dense to the densest scenario: (A) 3D Blob Image with o=1 and N=1,000. (B) 3D Blob Image with o=6 and N=1,000. (C) 3D Blob Image with o=1 and N=96,000. (D) 3D Blob Image with o=6 and N=96,000.
