
Fig. 2.
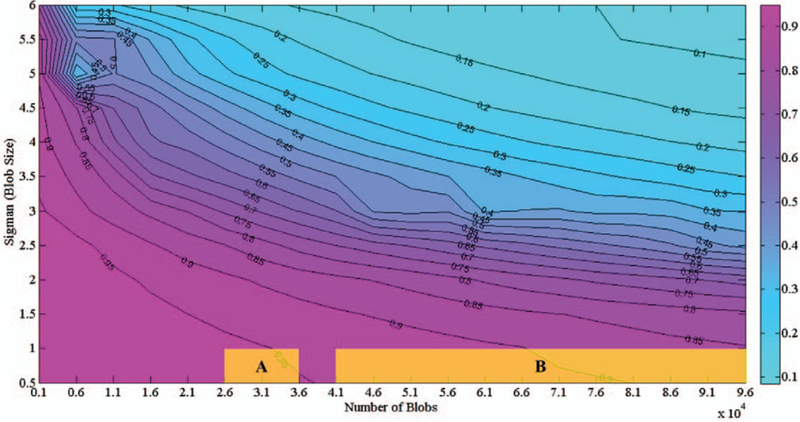
Contour Plot of F-Scores on Simulated 3D Images with Different Parameter Settings. In terms of blob size and quantity, the yellow shadow area A shows the scenarios of glomerulus detection on rat kidney images, and yellow shadow area B shows scenarios for glomerulus detection in human kidney images in our cases (based on the estimation of image size 256 × 256 × 256)