
Fig. 3.
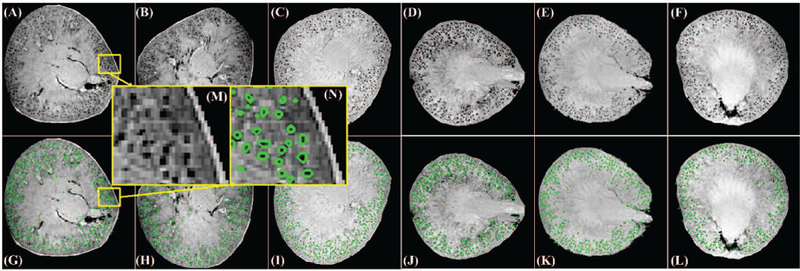
Glomerular segmentation results from 3D MR images of rat kidneys (selected slices presented). (A-C) Slice 100 for rats CF1, CF2, and CF3. (D- F) Slice 150 for rats CF4, CF5, and CF6. (G-I) segmentation results for (A- C), respectively. Identified glomeruli are contoured in green. (J-L) segmentation results for (D-F), respectively, where identified glomeruli are contoured in green. (M) is the zoomed-in region from (A) while (N) is the segmentation result of (M).