


Fig. 6.
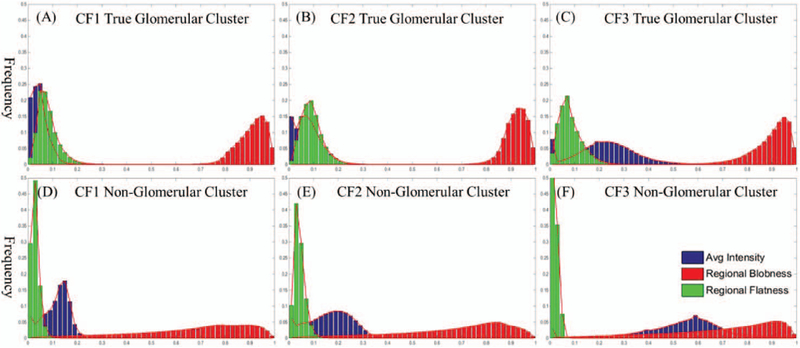
Frequency histograms of average intensity, regional blobness and regional flatness for human CF1, CF2 and CF3 kidney 3D MR images. (A)-(C) True glomerular cluster frequency histograms for human CF1, CF2 and CF3 respectively. (D)- (F) Non-glomerular cluster frequency histograms for human CF1, CF2 and CF3 respectively. Frequency range was [0, 0.5] and the x-axis range was [0, 1] in the Figure.