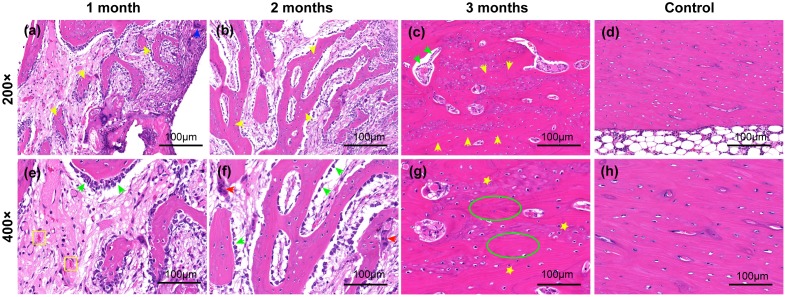
Fig 11. Representative images of H&E staining of decalcifying bone tissues around the implanted coated composite specimens at the indicated time points post-implantation.
(a-c): Experimental group, 200×; (e-g): experimental group, 400×; (d, h) control group, 200× and 400×. Yellow arrows: newly formed trabeculae; blue arrows: multinucleated giant cells; green arrows: osteoblasts; yellow squares: new capillaries; red arrows: osteoclasts; yellow stars: osteocytes; green ellipses: lamellar bone matrix.

