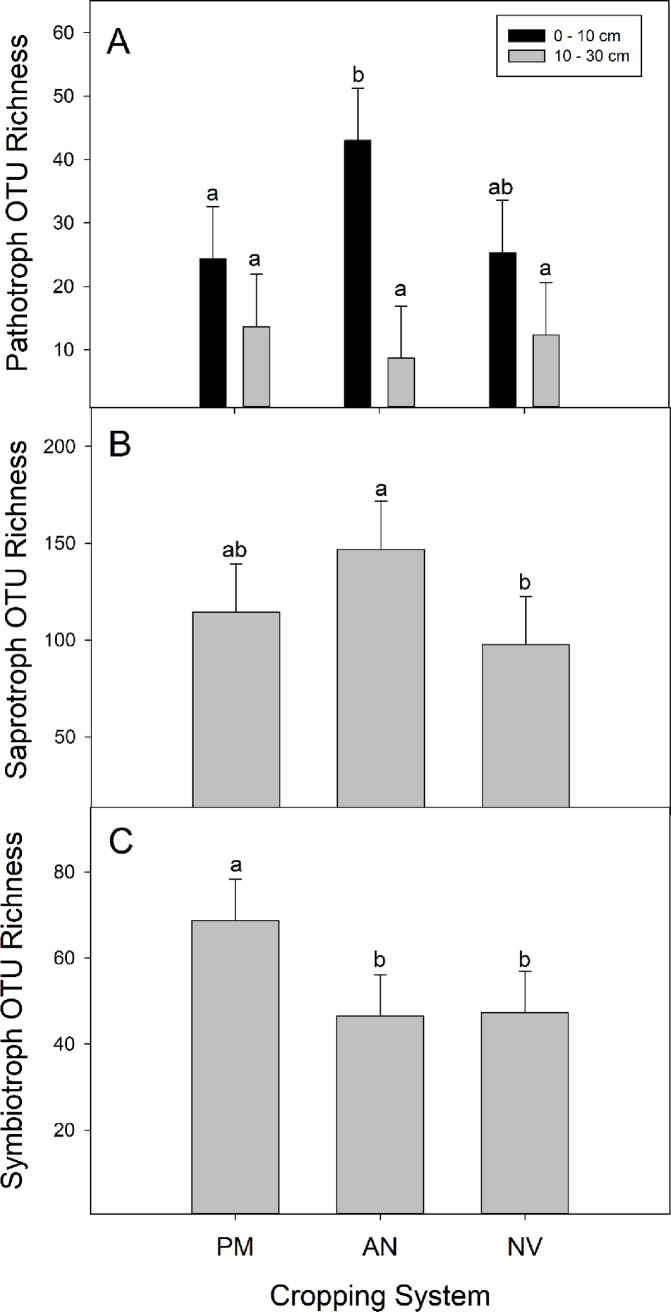
Fig 4.
Richness (Least Square mean ± 95% confidence limits) of Pathotroph OTUs in each cropping system (perennial monoculture (PM), annual agriculture (AN), and native vegetation (NV) and at each sampling depth (0–10 cm and 10–30; significant cropping system x depth interaction; A) and Saprotroph (B) and Symbiotroph (C) OTUs from the three cropping systems across sampling depths (significant main effect of cropping system). Different letters indicate a significant difference (Tukey’s HSD multiple comparison).

