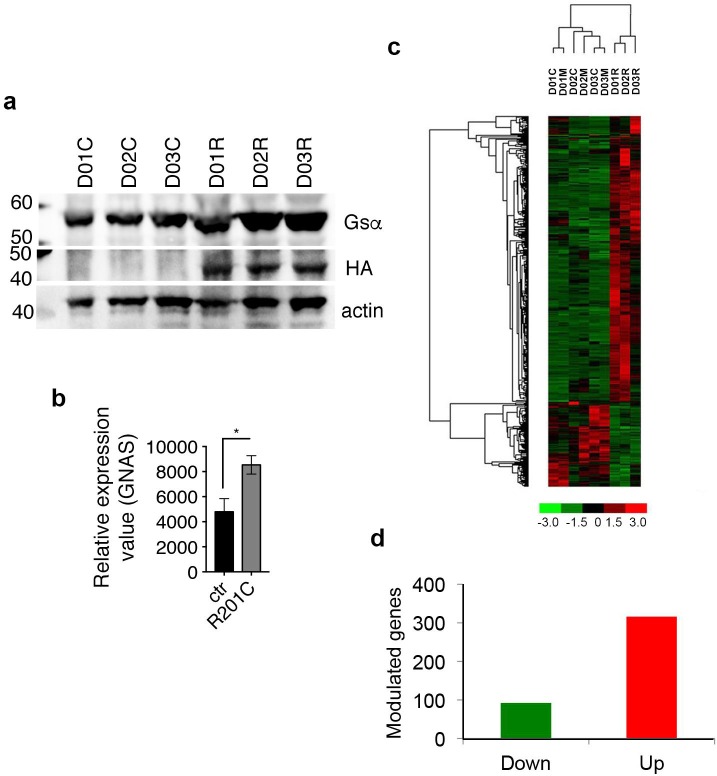
Fig 1. High throughput GeneChip analysis of GsαR201C hBMSCs.
(A) Western blotting on hBMSCs from three different individuals (D01, D02, D03), transduced with LV-Ctr (C), LV- GsαR201C (R) showing the expression of the exogenously provided mutant GsαR201C as highlighted by immunoblotting with anti-HA and anti-Gsα antibodies. 1.4 fold change on Gsα band in LV- GsαR201C (R) respect to that transduced with LV-Ctr (C) has been calculated as the average, on duplicates. (B) Relative values for GNAS expression in D01, D02, D03, transduced with LV-Ctr (ctr) or LV- GsαR201C (R201C) showing the expression of the exogenously provided mutant GsαR201C. 1.6 fold change on Gsα RNA expression has been calculated as the fold change on the average of triplicate samples from LV- GsαR201C and LV-Ctr samples. (C) Hierarchical clustering of modulated genes in triplicate samples of hBMSCs from three different individuals (D01, D02, D03), transduced with LV-Ctr (C), LV- GsαR201C (R) or mock-treated (M). (D) Total number of significantly modulated genes (threshold: 2.5). Up-regulated genes are indicated in red, down-regulated in green.

