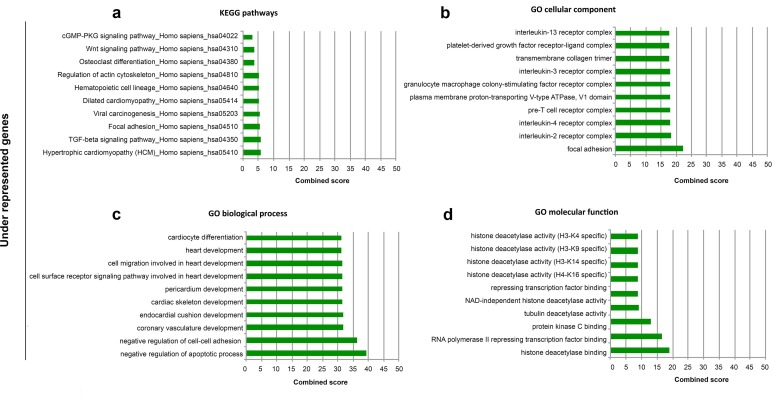
Fig 3. ENRICHR Gene Ontology and KEGG pathway analysis of significantly under-expressed genes of FD mutated cells.
Enrichment analysis was performed on significantly under-represented genes and ten most significant groups are represented according to KEGG pathway analysis (A), Gene Ontology (GO) cellular component (B), GO biological process (C), and GO molecular function (D). Enricher’s combined score combines z-score and p-value.

