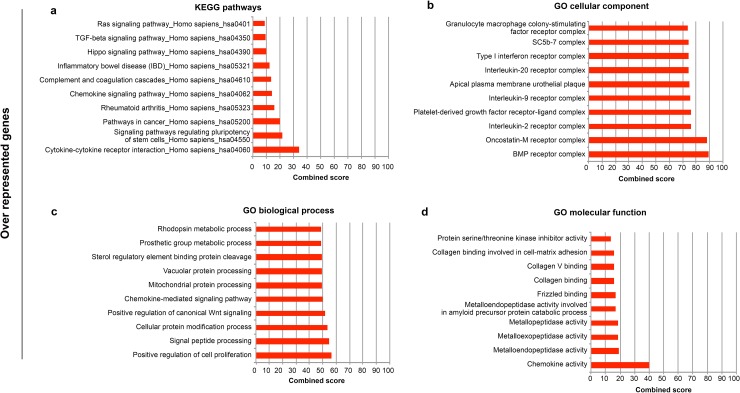
Fig 4. ENRICHR Gene Ontology and KEGG pathways analysis of significantly over-represented genes of FD mutated cells.
Enrichment analysis was performed on significantly over-represented genes and ten most significant groups are represented according to KEGG pathway analysis (A), Gene Ontology (GO) cellular component (B), GO biological process (C), and GO molecular function (D).

