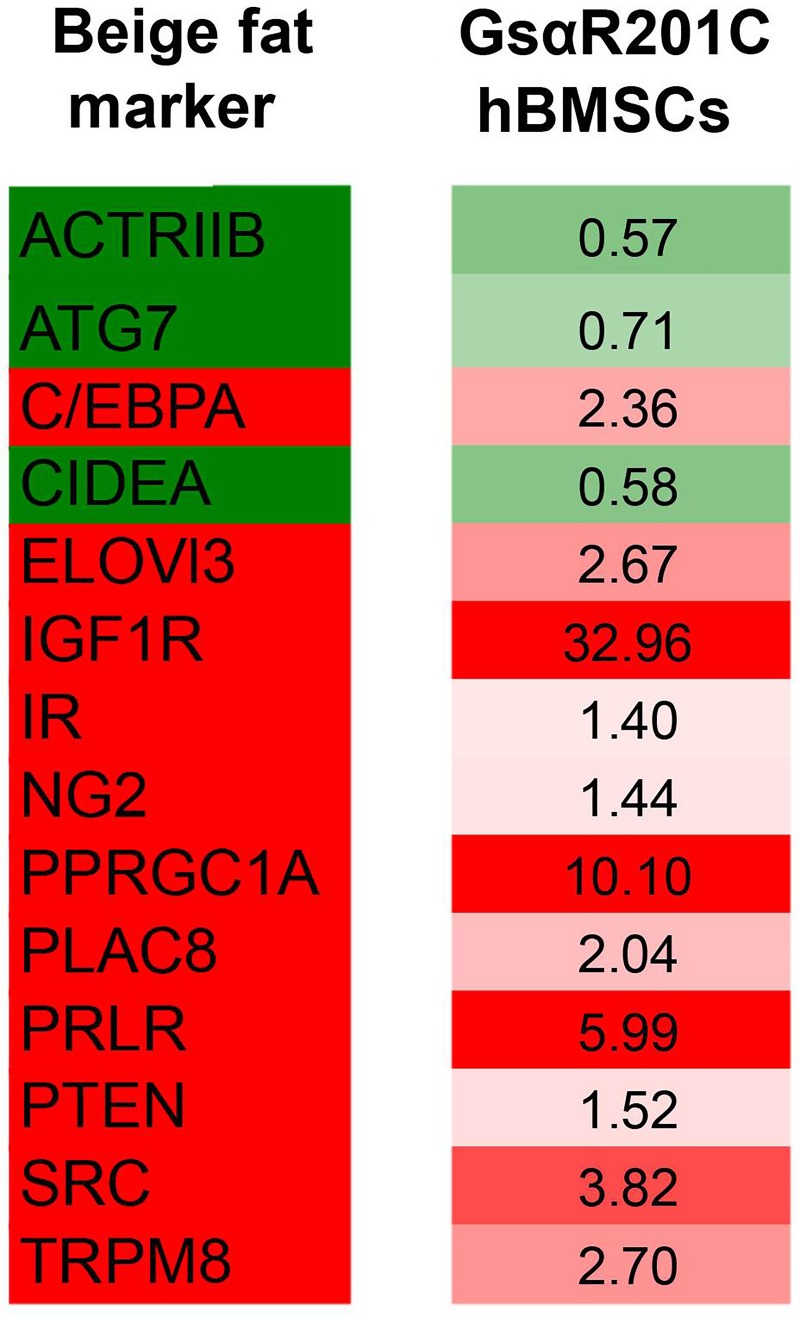
Fig 6. In silico comparative analysis of beige fat properties and GsαR201C induced modulation.
Taking as a reference the transcription status of beige fat markers ([51], Beige fat, left column), we observed that GsαR201C hBMSCs displayed an overlapping profile (GsαR201C hBMSCs, right column). Over-expressed genes are indicated in red, under-expressed genes in green. Fold change observed in GsαR201C hBMSCs is indicated.

