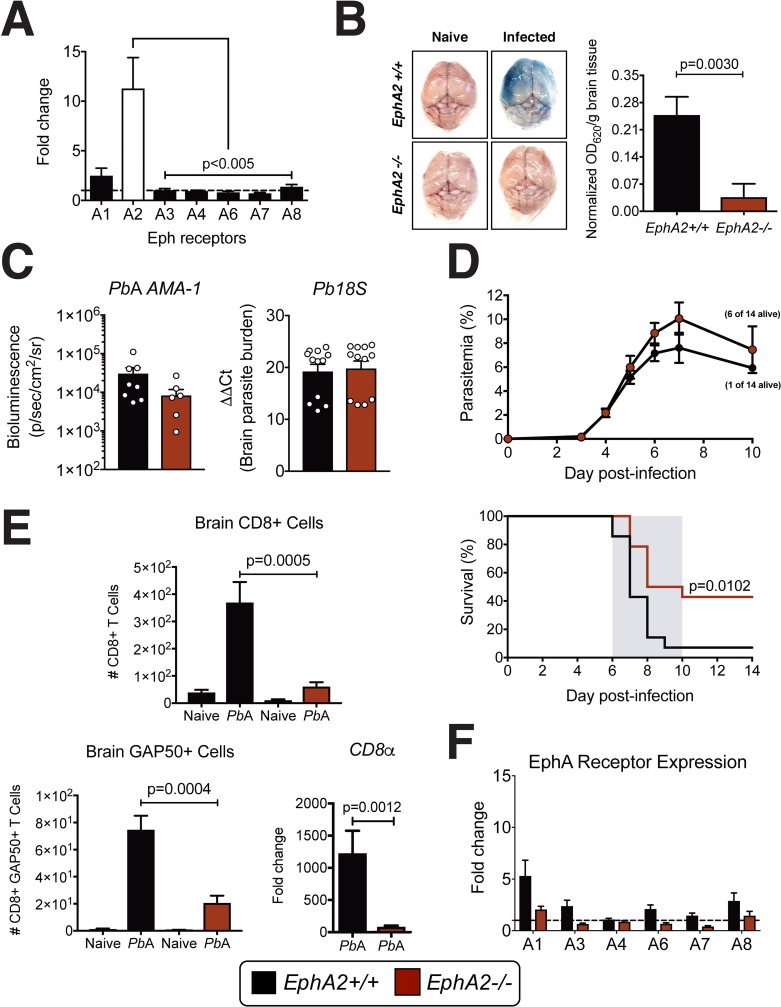
Fig 1. EphA2 is required for blood-brain barrier breakdown and the development of ECM.
(A) Transcription of EphA receptors relative to naïve mice (dashed line) in whole brains of C57BL/6J mice (n = 16/group) at day 6 post-infection with PbA. (B) Brain permeability in EphA2-/- and littermate control mice injected intravenously with 1% Evan’s Blue at day 6 post-infection with PbA. Representative images and quantification of dye extracted from whole brains is shown (n = 9-10/group). OD values are normalized to naïve mice from each respective group. (C) Quantification of sequestered PbA schizonts expressing luciferase under the AMA-1 promoter (n = 7-8/group) and 18S parasite DNA transcript (n = 12/group) in whole brains of EphA2-/- and littermate control mice at day 6 post-infection. (D) Peripheral parasitemia and survival of EphA2-/- and littermate control mice infected with PbA (n = 14/group). (E) Total CD8+ T cells (top left; n = 12-14/group), GAP50+CD8+ T cells (bottom left; n = 7-10/group), and transcription of CD8α relative to naïve mice (dashed line) (bottom right; n = 9/group) in brains of EphA2-/- and littermate control mice at day 6 post-infection with PbA. Naïve and PbA-infected groups are significantly different within each genotype. (F) Transcription of EphA receptors relative to naïve mice (dashed line) in whole brains of EphA2-/- and littermate control mice (n = 12-13/group) at day 6 post-infection with PbA. Bars in all graphs represent the mean ± SEM. Statistical analyses: Kruskal-Wallis and Dunn’s multiple comparisons tests (A), Mann-Whitney test (B, C, E) and Log-rank Mantel-Cox test (D). Only statistically significant (p<0.05) values are shown unless otherwise noted in the legend. Figures represent combined data from 2 (B, C-left panel, D, E-bottom left panel), 3 (C-right panel, E-top and bottom right panels, F), or 4 (A) independent experiments.

