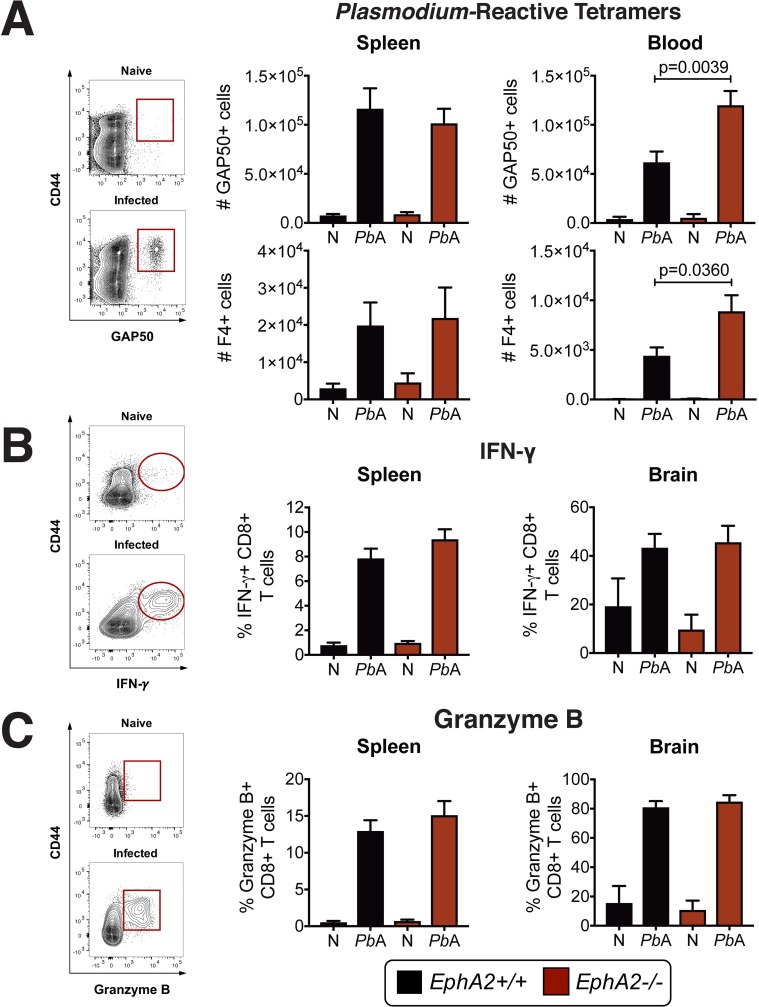
Fig 2. CD8+ T cell expansion and functionality is not affected by EphA2 deficiency.
(A) Representative staining and total numbers of Plasmodium GAP50-reactive (n = 11-18/group) and F4-reactive (n = 8-9/group) CD8+T cells present in the spleen (left) and bloodstream (right) of EphA2-/- and littermate control mice at day 6 post-infection with PbA compared to naïve (N) mice (n = 4-8/group). Naïve and PbA-infected groups are significantly different within each genotype for all graphs except bottom left. (B-C) Frequency of IFN-γ+ (B) or Granzyme B+ (C) CD8+ T cells in the spleen (n = 10-15/group) and brain (n = 7-10/group) of EphA2-/- and littermate control mice at day 6 post-infection with PbA compared to naïve (N) mice (n = 4/group). Naïve and PbA-infected groups are significantly different within each genotype for all graphs except EphA2+/+ in B-right panel. Bars in all graphs represent the mean ± SEM. Statistical analysis: Mann-Whitney test (A-C). Only statistically significant (p<0.05) values are shown unless otherwise noted in the legend. Figures represent combined data from 2 (A-bottom left and right panels, B-right panel, C-right panel), 3 (A-top right panel, B-left panel, C-left panel), or 4 (A-top left panel) independent experiments.

