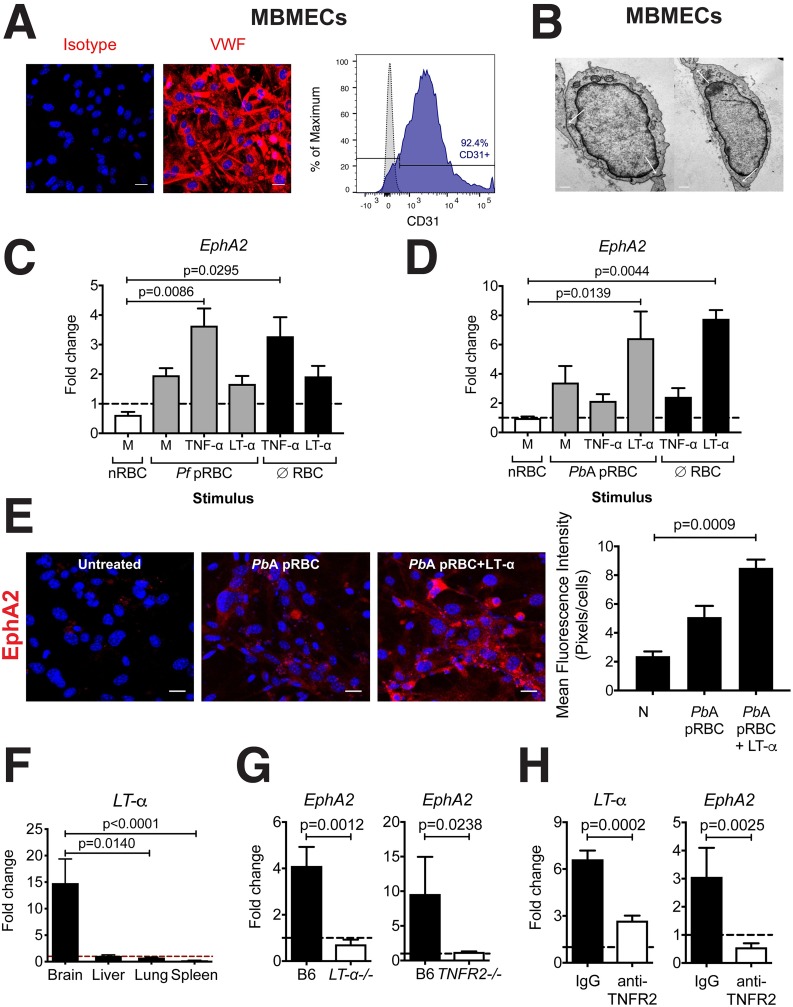
Fig 3. EphA2 is upregulated in human and mouse primary brain endothelial cells in response to inflammatory cytokines.
Representative data showing von Willebrand factor (VWF) immunofluorescence staining (cell nuclei stained with DAPI-blue) (A, left), CD31 flow cytometry staining (gray histogram: isotype control, blue histogram: anti-CD31) (A, right), and transmission electron microscopy (B) of cultured MBMECs isolated from C57BL/6J mice. White arrows in (B) indicate endothelial cell contact points. Scale bars represent 25μm (A) and 0.5μm (B). (C-D) EphA2 transcription in human (C) and mouse (D) BMECs incubated for 24 hours with naïve RBC lysates (nRBC), P. falciparum 3D7-infected RBC lysates (Pf pRBC), PbA-infected RBC lysates (PbA pRBC), or no RBC lysate (∅ RBC) plus human (C) or mouse (D) LT-α, TNF-α, or media (M) (n = 3–6 endothelial preparations/group). Values are normalized to untreated cells. (E) Immunofluorescence images and fluorescence quantification of EphA2 (red) on MBMECs unstimulated or stimulated with PbA-infected RBC lysates (PbA pRBC) in the presence of absence of LT-α for 24 hours. Cell nuclei stained with DAPI (blue). Scale bars represent 25μm. Images representative of two endothelial preparations. (F) LT-α transcription relative to naïve mice (dashed line) in whole brains, livers, lungs, and spleens of C57BL/6J mice (n = 8-9/group) at day 6 post-infection with PbA. (G) EphA2 transcription relative to naïve mice (dashed line) in brains of LT-α-/- (n = 7) and TNFR2-/- (n = 3) mice at day 6 post-infection with PbA compared to wild-type C57BL/6J mice (n = 6–11). (H) LT-α and EphA2 transcription relative to naïve mice (dashed line) in brains of isotype control (n = 9) and anti-TNFR2 (n = 8) treated mice at day 6 post-infection with PbA. Bars in all graphs represent the mean ± SEM. Statistical analyses: Kruskal-Wallis and Dunn’s multiple comparisons tests (C, D, E, F) and Mann-Whitney test (G, H). Only statistically significant (p<0.05) values are shown. Figures represent combined data from 1 (G-right panel), 2 (E, F, G-left panel, H), or 3 (C, D) independent experiments.

