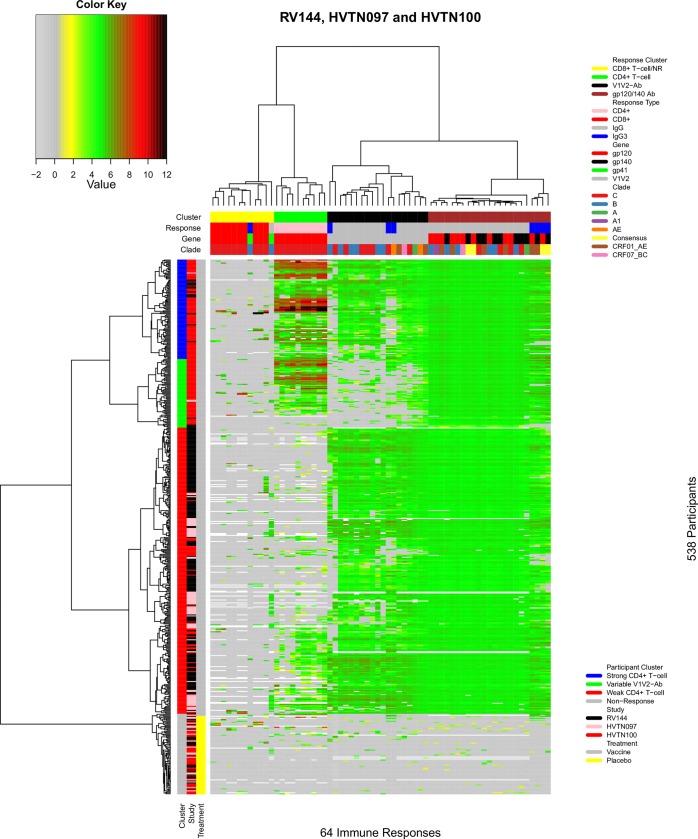
Fig 1. Landscape of immune responses to the PAE/B/alum and PC/MF59 regimens.
The heatmap was generated by two-way hierarchical clustering of participants and immune response variables based on their similarity after bi-directional power transformation of the immune response measurements. The 64 immune response measurements shared across RV144, HVTN 097, and HVTN 100 participants were used. Columns designate immune responses; cluster, response, gene, and clade information are given in the top 4 color-coded bars. Rows designate participants; cluster, study, and treatment assignment information are given in the three color-coded bars on the left. Dendrograms on the top and left illustrate column and participant clustering, respectively. Immune response measurement values are designated by color according to the key shown in the upper left.

