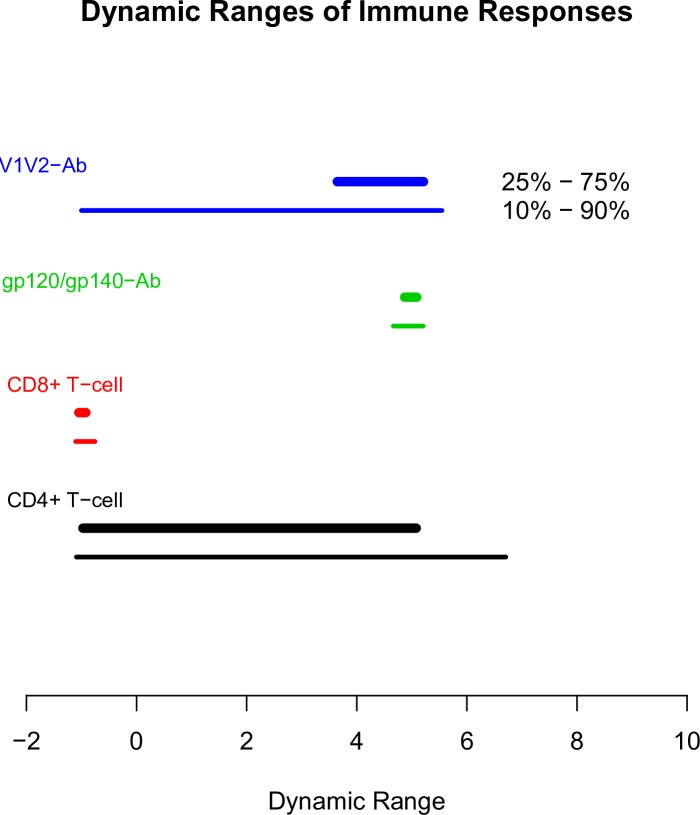
Fig 6. Dynamic ranges of the 64 immune responses shared across the three trials.
The ranges of the immune responses after bi-directional power transformation are shown (25th percentile to 75th percentile, thicker lines; 10th percentile to 90th percentile, thinner lines). Lines are color-coded by response type.

