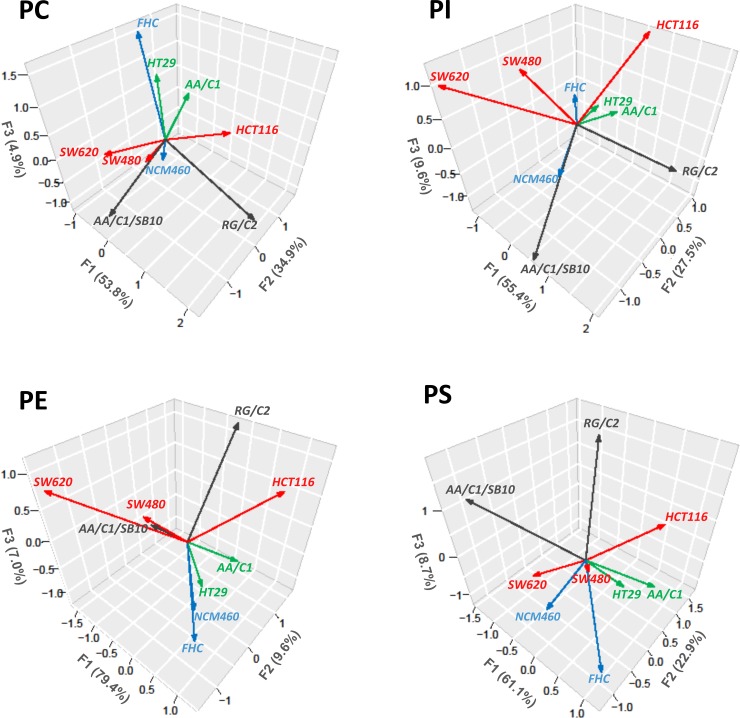
Fig 2. Principal component analysis (PCA) of PL species amount in colon cell lines.
Phosphatidylcholine (PC): The first component (F1) is strongly correlated with species 36:3 (MW 783.7) and other 6 species with MW > 800 (see Fig 3), i.e. the first principal component increases with increasing species with 3 or more DBs. This suggests that these species exhibit a common trend–if one increases, then the remaining ones tend to increase as well. The component F2 is correlated with species with MW <733. The component F3 correlates with species 34:1, 36:2 and 36:1. These three components explain 93.6% variation of the PC data in total. Phosphatidyletanolamine (PE): The first component is strongly correlated with species with MW <720, 747.6 and 829.7 and explains almost 80% variation of the data. F2 correlates with species with ≥3 DBs and F3 with species 771.6 (38:2) and 799.6 (40:2). Phosphatidylinositol (PI): Three components explain >90% variation of the data; all examined PI species are strongly correlated with one of these 3 components. Species with 3 or more DBs correlates with F1; species with MW<865 and with 1 or 2 DBs are included in F2, whereas F3 is strongly correlated with remaining 38:2 species (MW 876.6 and 890.7). Phosphatidylserine (PS): F1 correlates with low MW species (<780), F2 correlates with higher MW species (≥815) and F3 with middle MW species, especially PS 38:4 and 38:5. For more details and potential FA composition of individual MW species, see S2 Table.

