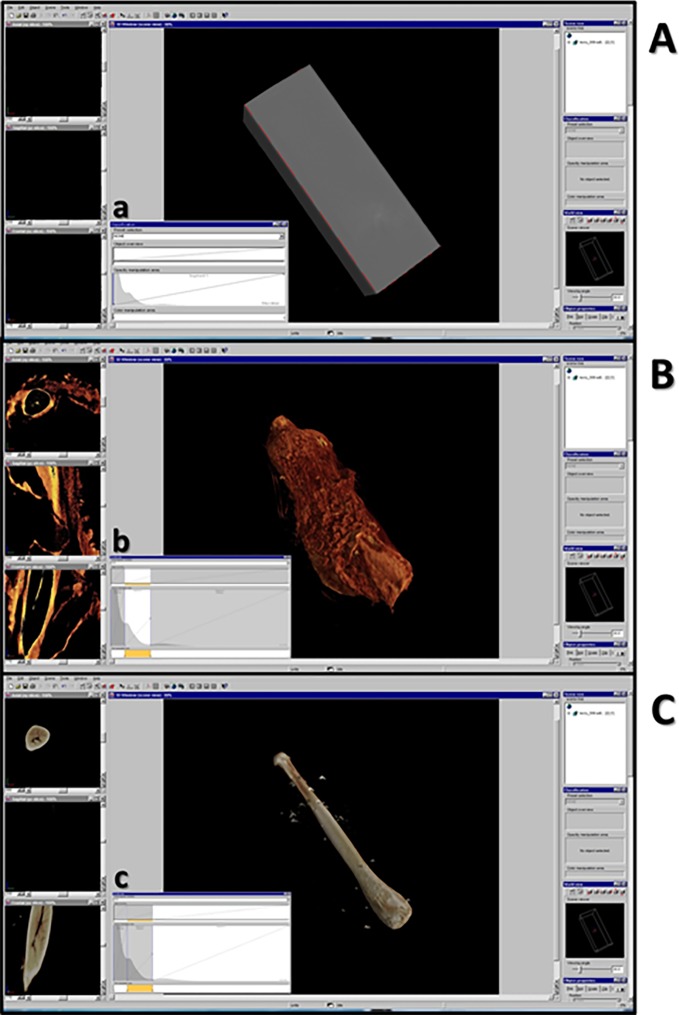
Fig 2. Rendering and data processing commercial software: VGStudio Max 1.0.
The user interface showing the reconstructed 3D volume of genital bone in Loris lydekkerianus. A: the reconstructed 3D volume appears as a gray and opaque parallelepiped. The gray value histogram (a) with air, soft tissue and bone peaks is shown. B: selecting the segment of the gray value histogram (b) corresponding to air peak, and disabling it, makes soft tissues visible; on the left, there are 2D views of three orthogonal cross sections: axial (up, for x-y slices); sagittal (middle, for y-z slices); frontal (down, for x-z slices). By scrolling bars under each orthogonal view, it is possible to choose the single slice to be visualized. C: selecting and disabling segment of the gray value histogram (c), corresponding to soft tissue peak, make the bone visible.

