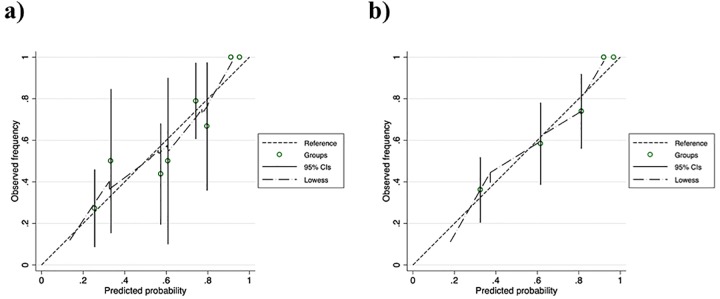
Fig 2. Calibration plots of (a) the original predivtive rule and (b) PVC-GN scoring system.
The dashed lines reflect perfect calibration between the ovserved frequency and predictive probability as reference. The long-dashed lines depict smooth nonparametric fits using locally weighted scatter plots for smoothing (Lowess).

