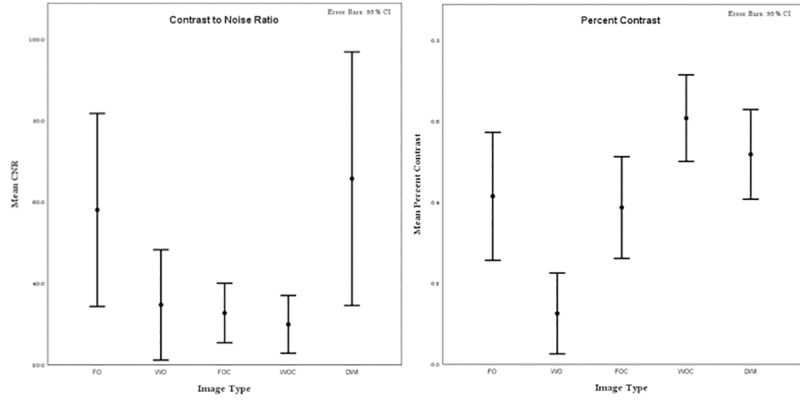
Fig 4. Comparison of percent contrast and CNR between groups.

The figures show the results of a post- hoc multiple comparison test from a one-way ANOVA. Estimates of Percent Contrast and CNR are shown as circles; the comparison intervals for each group are shown as the whiskers.
