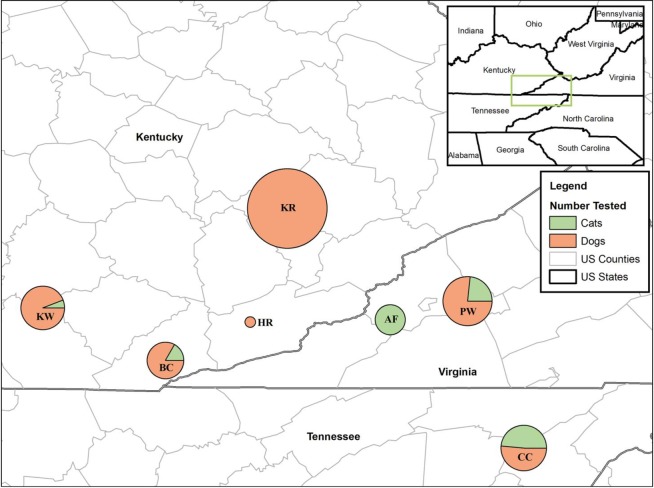
Fig 1. Map depicting the proportion of cats and dogs from seven shelters in Kentucky, Tennessee, and Virginia that were tested in this study.
Samples were collected from 113 animals (all dogs) from Shelter KR, 34 animals (32 dogs and 2 cats) from Shelter KW, 24 animals (20 dogs and 4 cats) from Shelter BC, 2 animals (both dogs) from Shelter HR, 43 animals (33 dogs and 10 cats) from Shelter PW, 16 animals (all cats) from Shelter AF, and 37 animals (19 dogs and 18 cats) from Shelter CC. Map created with ArcMap 10.6 (Esri, Redlands, CA).

