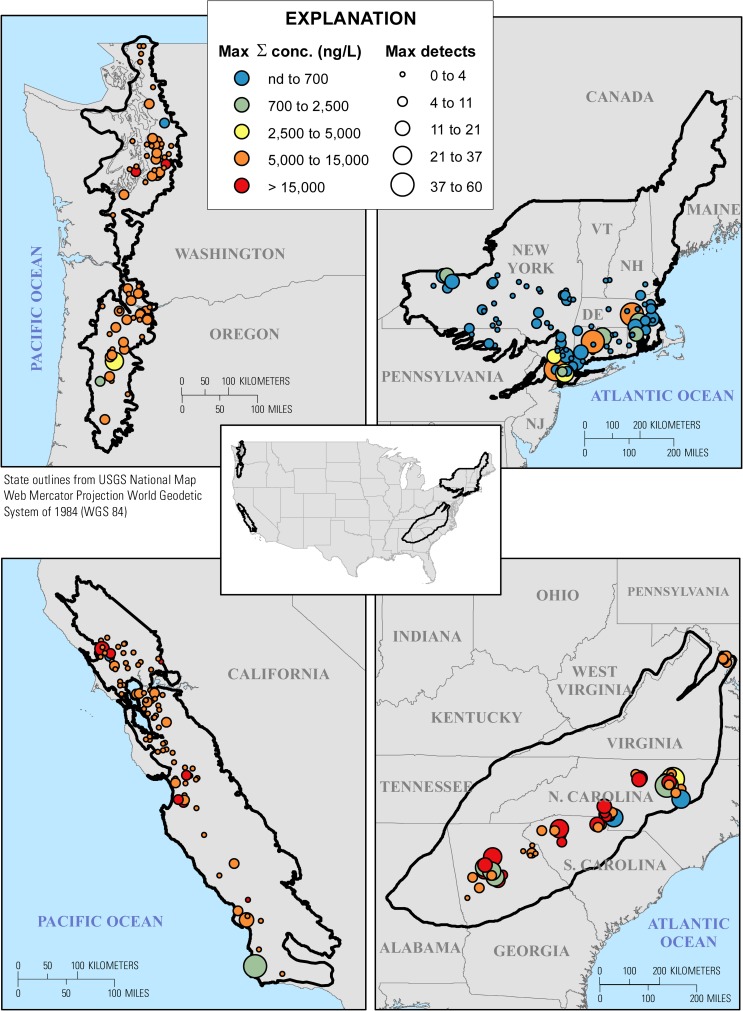
Fig 1. Cumulative maximum concentrations (ng/L) and numbers of pharmaceuticals detected at least once during the 2014–2017 synoptic samplings of water from wadeable streams in the Pacific Northwest (PNSQA, 2015; upper left), Northeast (NESQA, 2016; upper right), California (CaSQA, 2017; lower left), and Southeast (SESQA, 2014; lower right) regions as part of the USGS Regional Stream Quality Assessment (RSQA).
For site details see S1 and S6 Tables. North is at top. Base-map image is from the USGS National Map [55].

