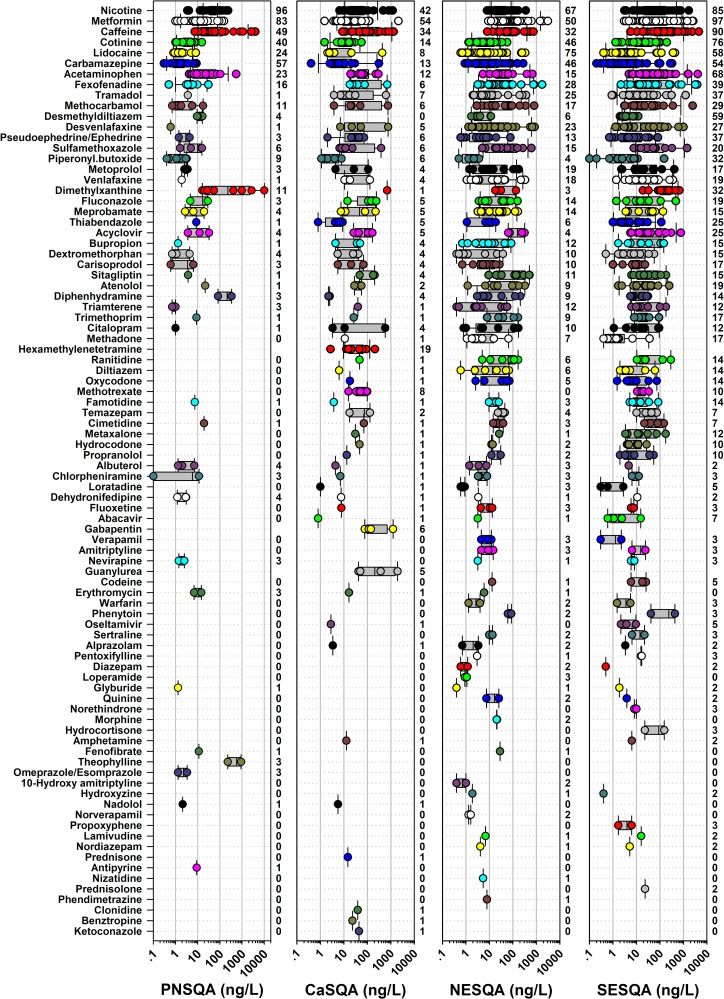
Fig 3. Maximum concentrations (ng/L) of 88 pharmaceuticals detected at least once (in order of decreasing number of detections across all regions and samples) in water samples from wadeable streams in each region as part of the USGS Regional Stream Quality Assessment (RSQA).
Circles are data for individual sites. Boxes, centerlines, and whiskers indicate interquartile range, median, and 5th and 95th percentiles, respectively. Numbers to the right of each plot indicate the percentage of sites within the region at which the compound was detected at least once. Gabapentin, guanylurea, and hexamethylenetetramine were analyzed only in CaSQA samples.

