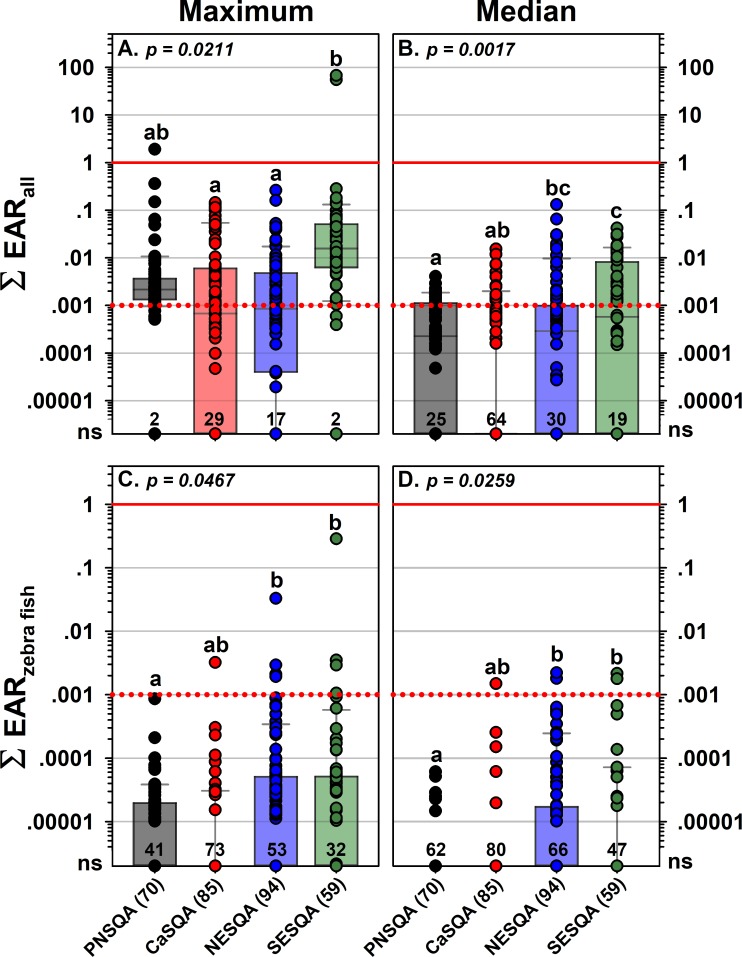
Fig 4.
Cumulative maximum (left) and median (right) Exposure-Activity Ratios (ΣEAR) of ToxCast all (primarily molecular, top) and zebra-fish only (bottom) endpoints for pharmaceuticals detected in water samples from wadeable streams in each region (total sites in parentheses) as part of the USGS Regional Stream Quality Assessment (RSQA). Boxes, centerlines, and whiskers indicate interquartile range, median, and 5th and 95th percentiles, respectively, for multiple-sample sites (circles), only. For each plot, p is the permuted probability that the centroids and dispersions across all groups are the same and different letters indicate groups with pairwise probabilities that are less than 0.05 (PERMANOVA) for multi-sample sites only. Numbers above X-axes in each plot indicate number of sites with no significant activity (ΣEAR < 0.00001).

