
Figure 5. Anti-metastatic potential of TAP NPs.
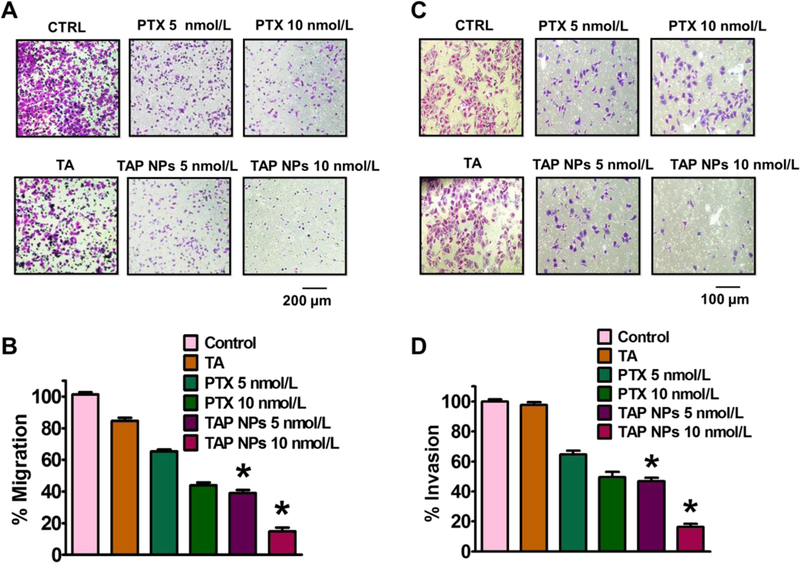
A) Migration assay to determine inhibition potential of breast cancer (MDA-MB-231) cells after exposure to 5 and 10 nmol/L of PTX or TAP NPs (PTX equivalent) for 24 hours. Migratory cells were fixed with 4% formaldehyde and stained with crystal violet and imaged using EVOS® FL Imaging System (scale = 400 µm). Representative bar graphs of the number of migratory cells with each treatment group, where untreated (control) cells served as an experimental control and was considered as 100% and other treatment groups expressed as percentage with respect to the migrated control cells. B) Matrigel Invasion assay showing similar effects, upon treatment with TAP NPs and PTX (5 and 10 nmol/L equivalent to PTX) for 24 hours. Invasive cells following incubation with PTX and TAP NPs were fixed with methanol and stained using crystal violet. Imaged using EVOS® FL Imaging System (scale = 200 μm). Percentage inhibition of invasive breast cancer cells upon treatment and data represented as a bar graph with respect to untreated (control) cells which also served as our experimental control. Data represented as mean ± standard error of the mean (n = 3).